The Dashboard
The Dashboard is your team's start page. It answers four questions in order: does anything need me, is the data complete and current, how is consumption developing, and does the data reach my systems. When there is nothing to do, you see that at once and don't have to search a list.
Layout
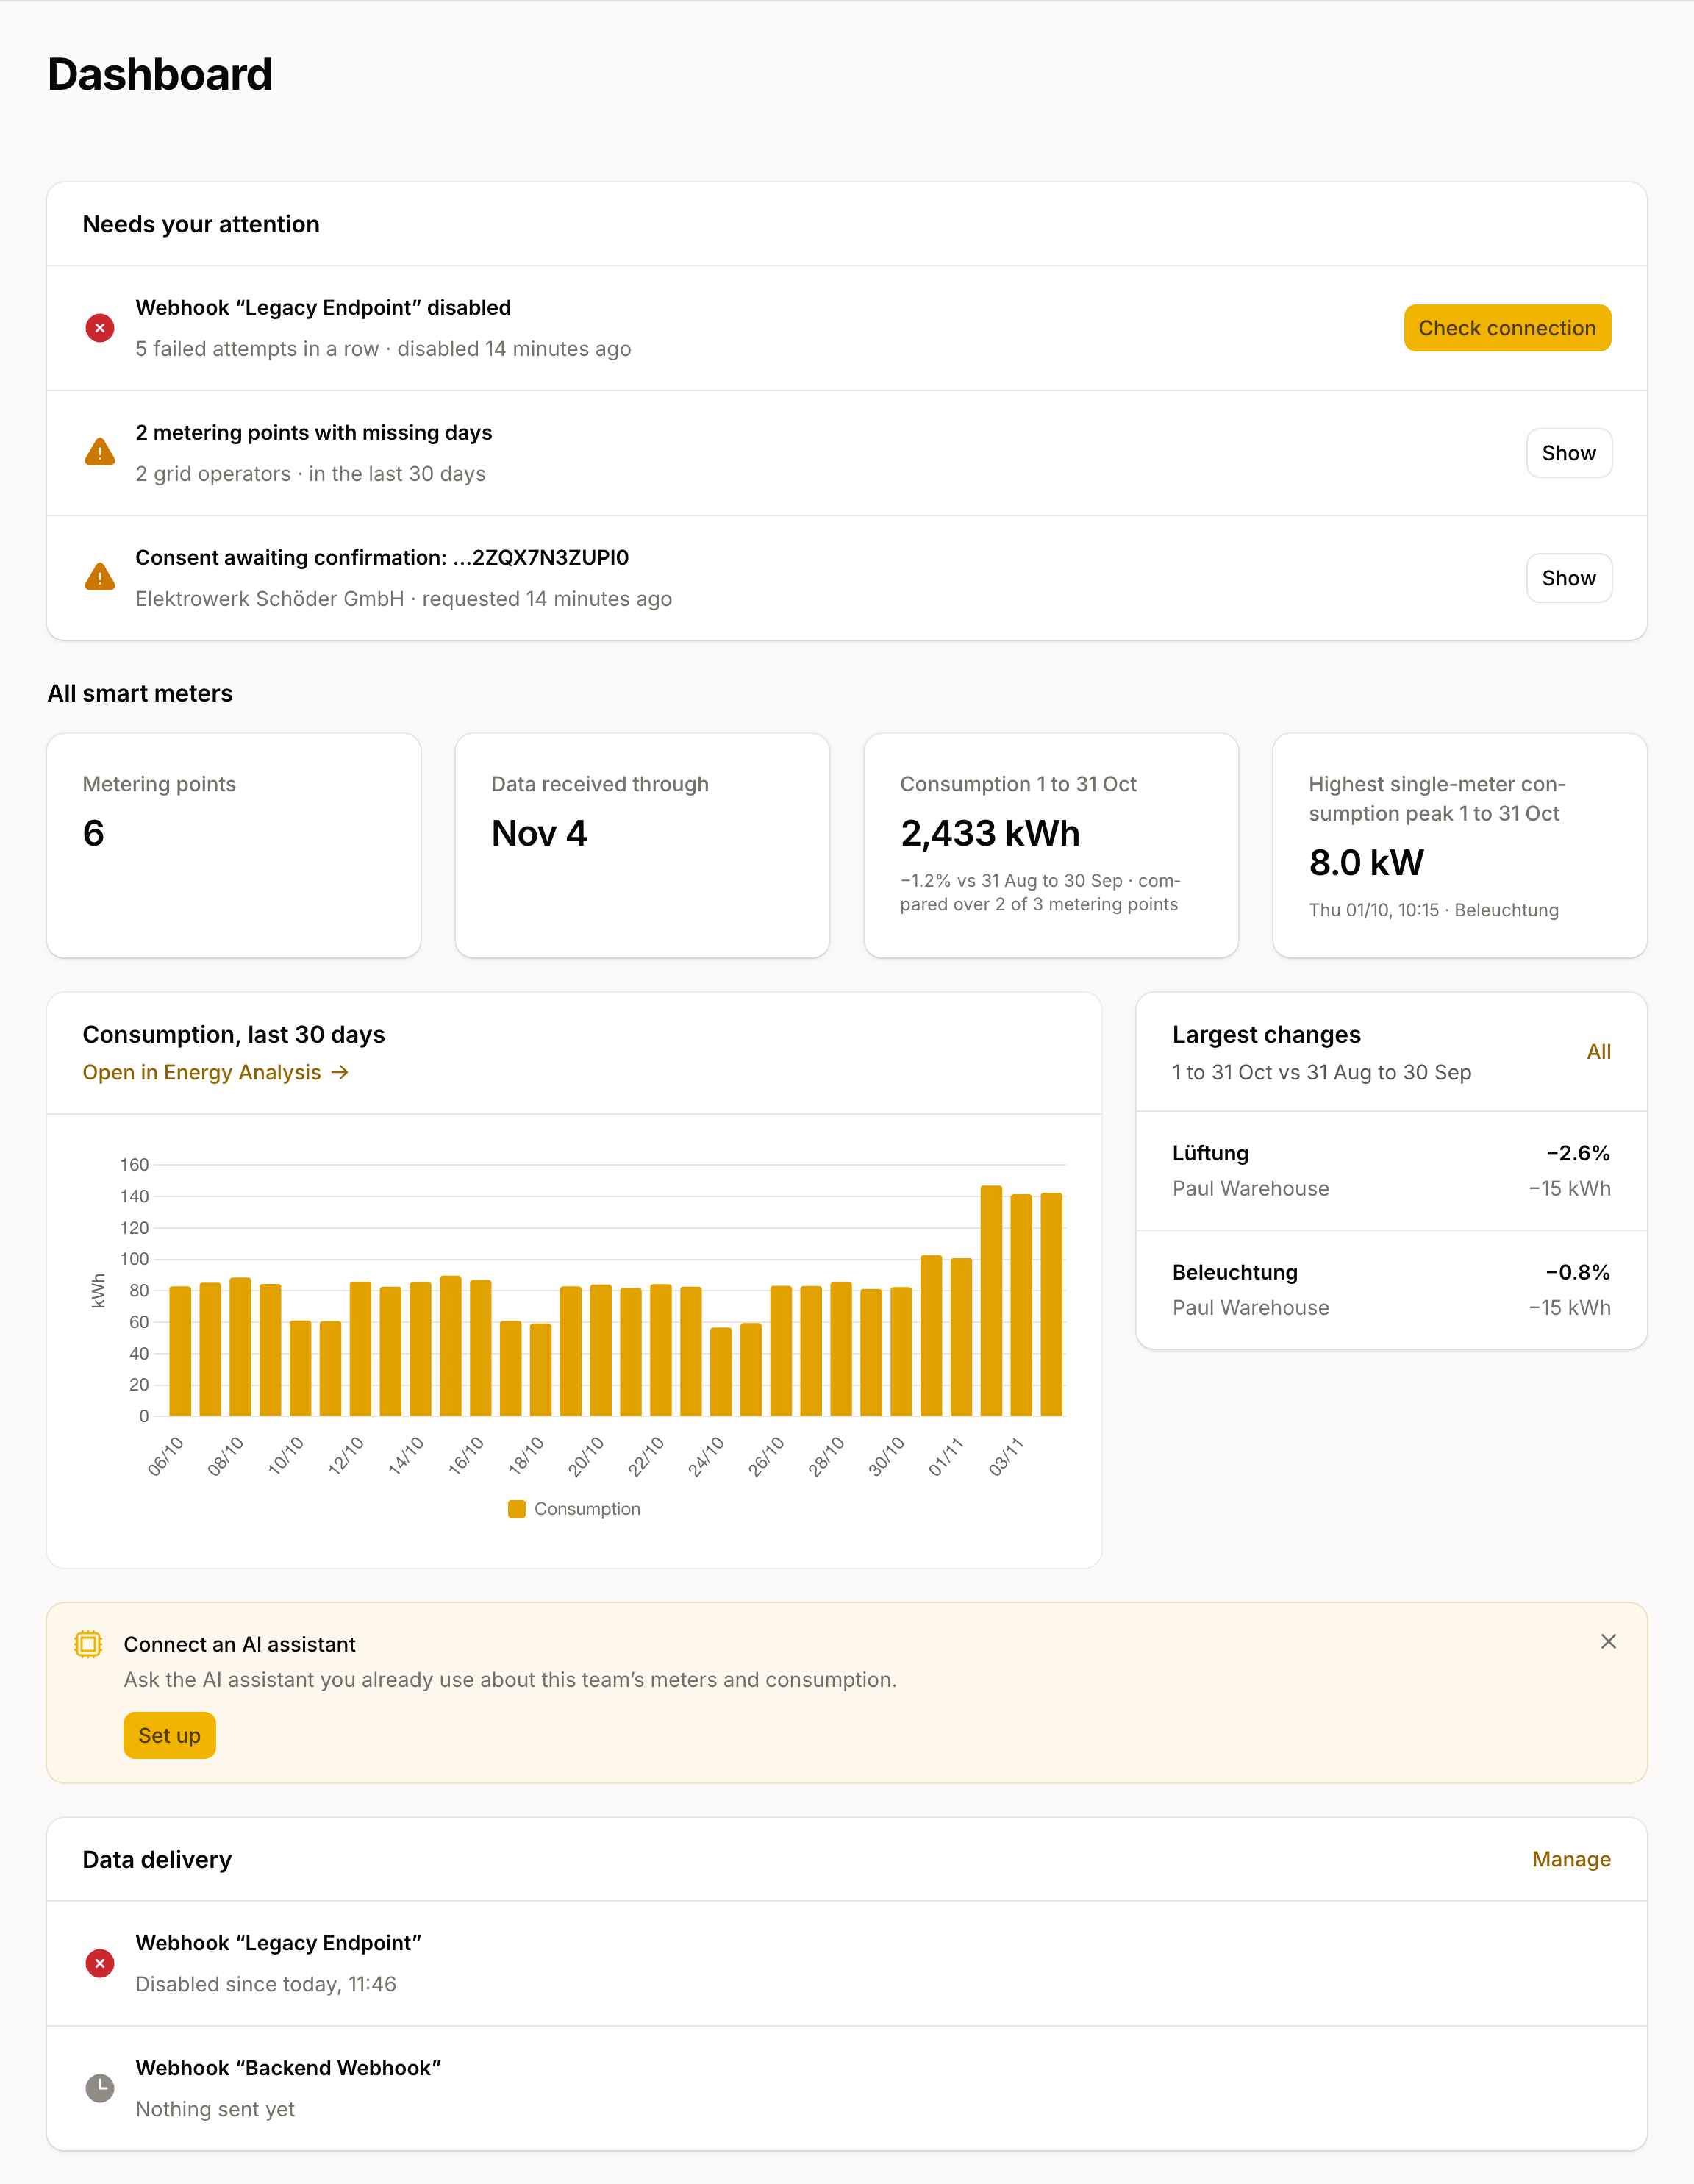
From top to bottom, the Dashboard shows:
- A platform notice, when an important notice applies to all teams.
- Needs your attention: one row per problem or open setup step.
- Key figures: metering points, data status, and the current month's consumption with the highest power peak.
- Consumption over the last 30 days and Largest changes, the metering points whose consumption moved furthest from the comparison period.
- Data delivery: the state of your connections and scheduled exports.
- News from the blog and news posts.
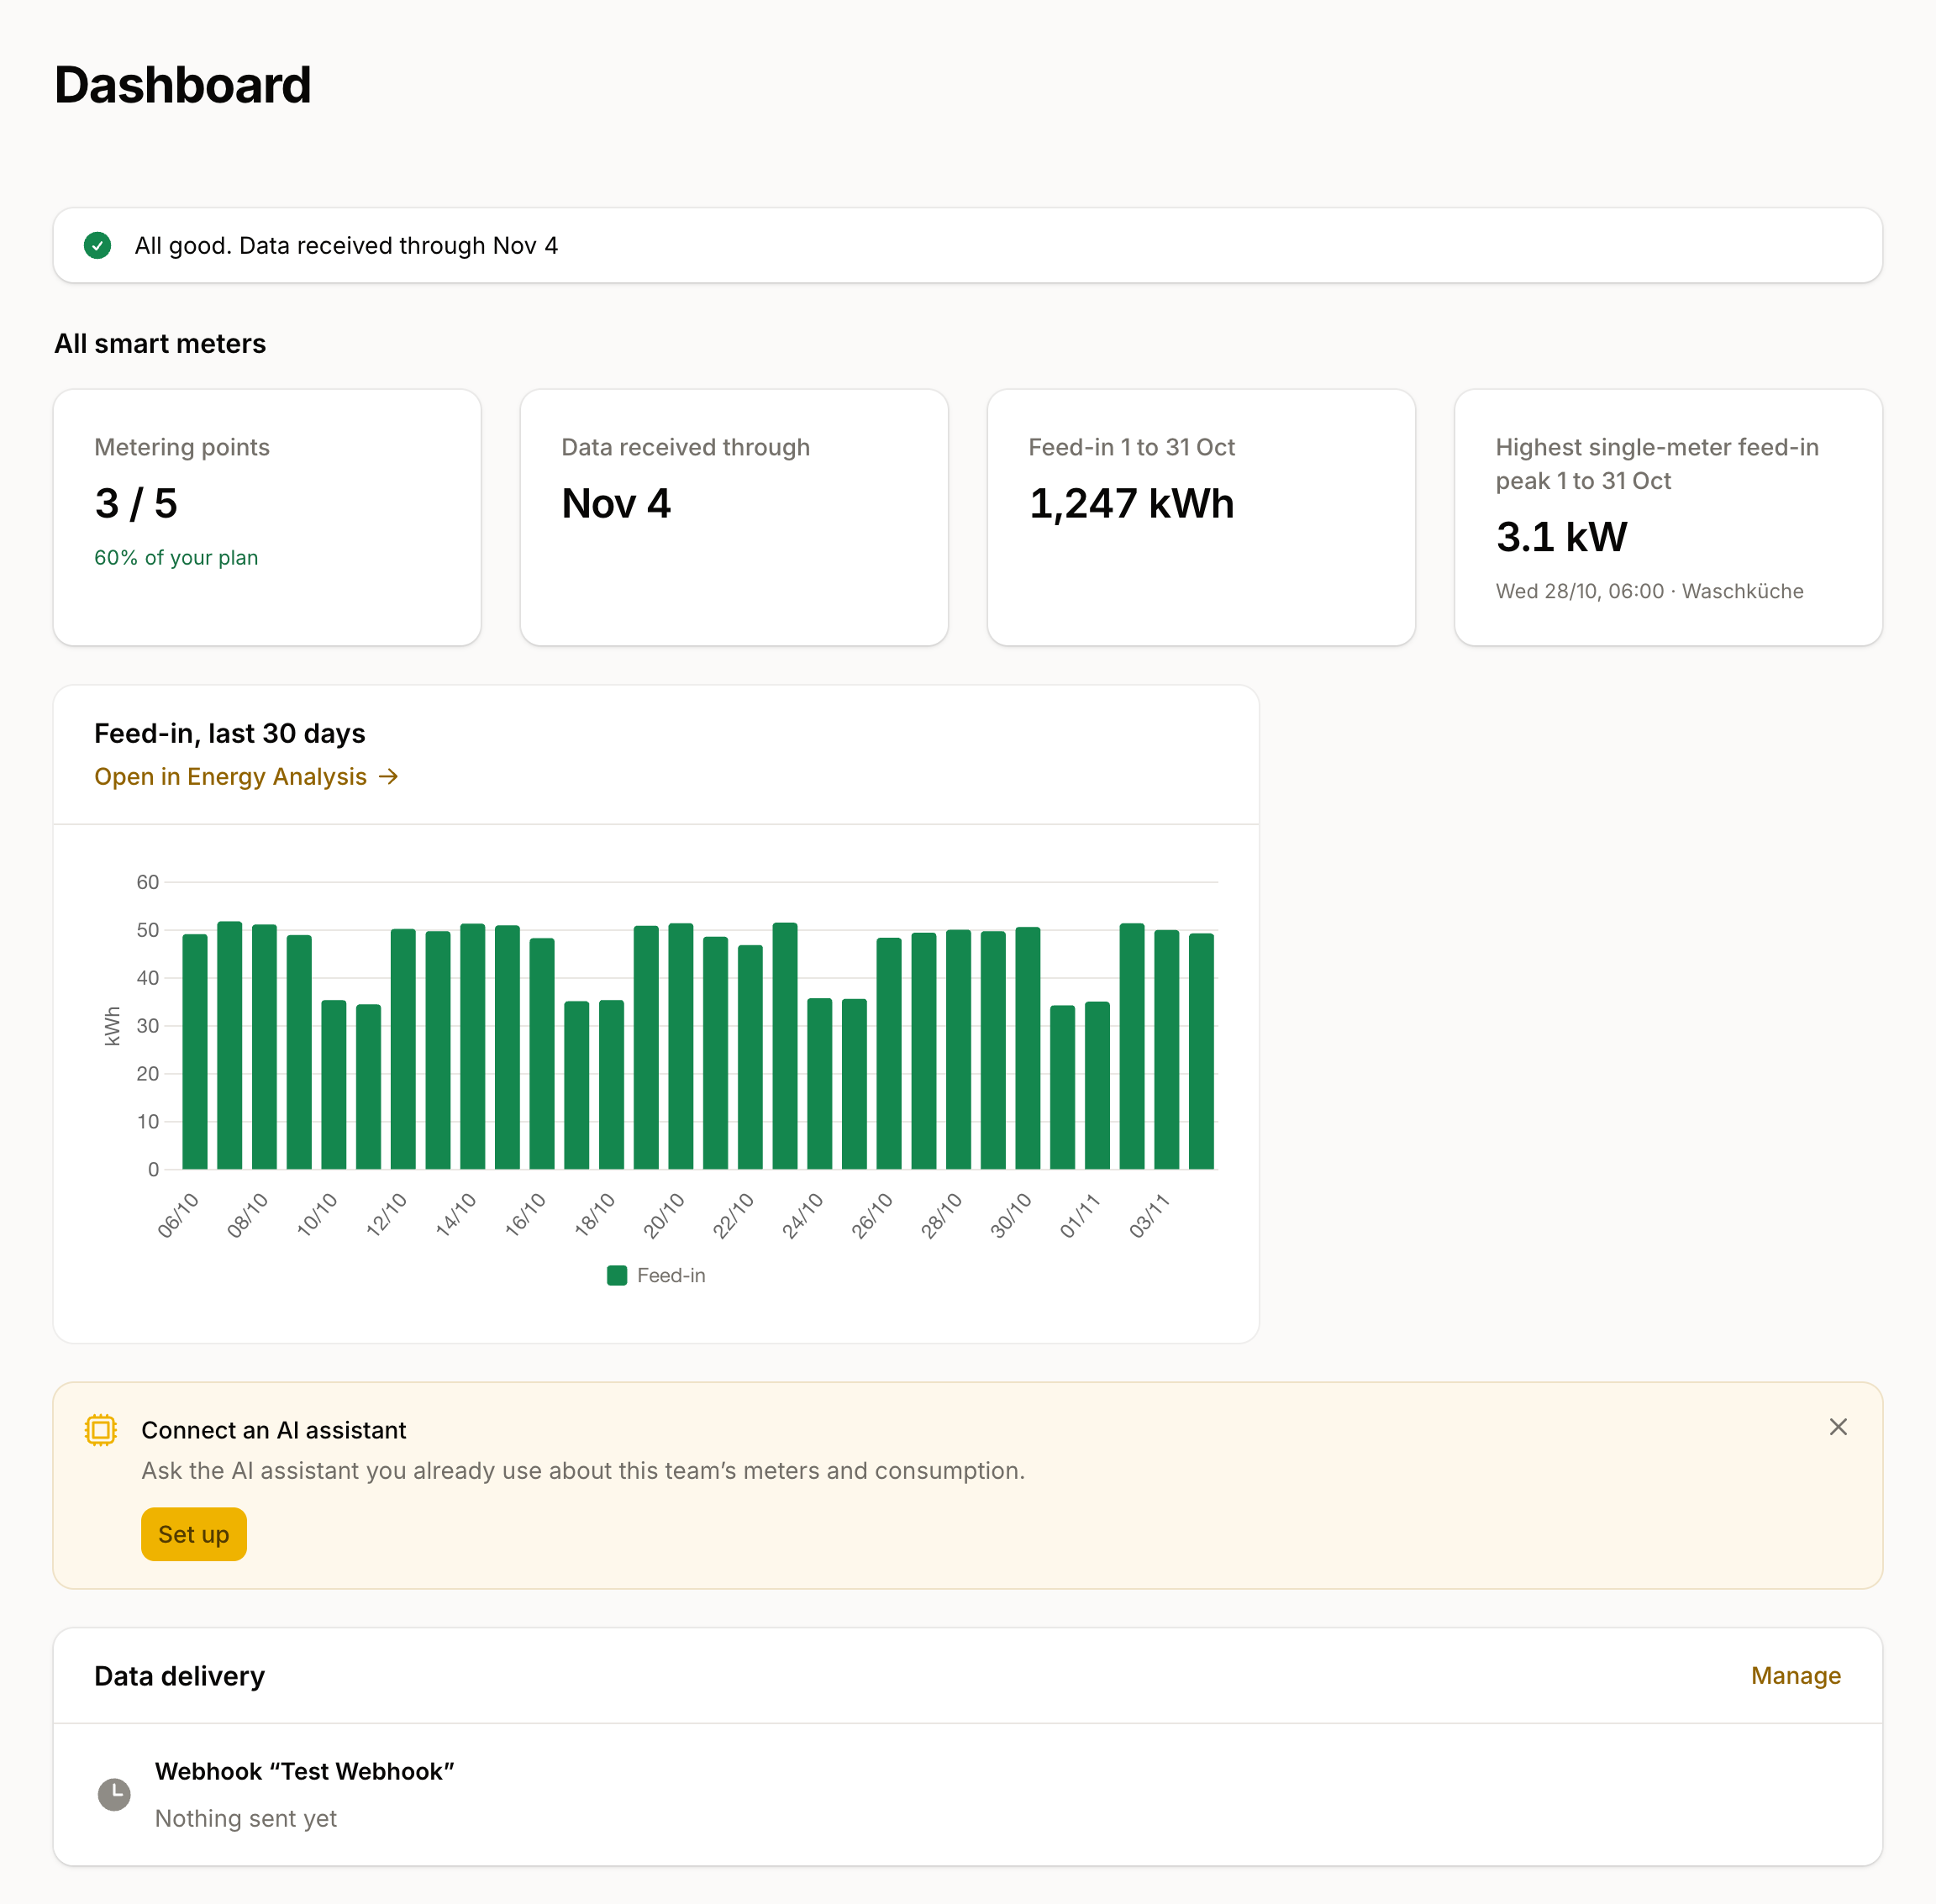
A block with nothing to say is left out. Until your team has measurement data there are no key figures and no chart, so you never see a row of zeros. The Data delivery block appears once you have set up a connection or a scheduled export. A card for connecting an AI assistant appears once data has arrived and can be dismissed; the dismissal applies to you only.
Needs your attention
Rows are sorted by urgency: Critical, Warning, Note, then the setup steps. Each row has exactly one button that leads to the problem, and the first row's button is highlighted. When a problem affects several metering points, the row summarizes them and opens the filtered list; when it affects exactly one, the row names it and opens it directly.
When nothing is open, the list says "All good" with the day through which all metering points have delivered data. While metering points are waiting for a consent or a request, the list refreshes regularly.
What each row means and what you do
| Row | Level | What you do |
|---|---|---|
| Request failed or rejected | Critical | The grid operator rejected the request; for a single metering point the reason is in the row. Correct the details and send again: Common errors. |
| Metering point has sent no data for n days | Critical | From 4 days without new values. For one metering point the button opens it, for several it opens Data Completeness. If the gap persists, ask the grid operator. |
| Connection (webhook, MQTT, email, SFTP) disabled | Critical | The connection switched itself off after persistent failures. Fix the cause at the receiver and re-enable the connection: Delivery logs. |
| Missing days | Warning | Days without data in the last 30 days. The Data Completeness report shows which. A metering point that has sent nothing for 4 days or more gets no row of its own here, the "no data" row covers it. If they lie further back, historical data can help. |
| Consent awaiting confirmation | Warning | The customer has not yet confirmed the request in their grid operator's portal. Remind them: The consent process. |
| Metering point has not sent any data yet | Warning | Connected for at least 4 days, but no value has arrived: First data. |
| Connection is failing | Warning | The latest deliveries failed and the connection is still active. Check the receiver before it switches itself off: Delivery logs. |
| Scheduled export not delivered | Warning | The latest send of an active export failed. Check the recipient and settings in the export; the next run tries again: Scheduled exports. |
| API key expires | Warning | A key expires within 14 days. Create a new one and enter it in the software that uses it (Home Assistant, ERP), otherwise its requests stop. |
| Switch per-community data by a date | Warning | Your plan no longer includes it; without a switch we disconnect the affected metering points. Change your plan: Change plan. |
| Unreliable substitute values | Note | Electricity substitute values of quality level L3 exist in the last 30 days. The grid operator replaces them later; until then don't use them for billing: Data quality. |
| Requests held during EDA maintenance | Note | A maintenance window in the data exchange holds requests back. They go out at the time shown, and you don't need to do anything. |
| Metering point limit reached or almost reached | Note | From 90% of your plan's metering points. If you need more, change your plan: Change plan. Without billing permission, the row points you to a team admin. |
Rows about connections and scheduled exports only appear when your plan includes these delivery channels. The rows for API keys, the metering point limit and the community switch concern the whole team, so they disappear once you select a customer.
Setup steps
A new team sees the steps up to the first data in its own systems at the end of the list. Each step disappears once it is done:
- Add your first metering point, until the first real metering point exists. An integration test meter doesn't count.
- Confirm the consent in the grid operator portal, until a metering point is connected or has delivered data. The button opens the help article on the consent process in a new tab.
- Receive the first data, until the first value has arrived. The button opens the article First data.
- Pass the data on, while you have no connection, no scheduled export and no API key. The step only appears when your plan includes one of these channels and names them. It leads to the integrations catalog. If your plan only has scheduled exports, it opens the form for a new export directly.
With a customer selected, the setup steps are left out.
Key figures and trend
- Metering points shows your team's metering points against your plan's limit, or for a selected customer, that customer's connected metering points.
- Data received through names the day through which every delivering metering point has sent data, and how many are still behind. It is green when no metering point is behind and the data status is at most one day old, yellow at 2 to 3 days and red from 4. A click opens the Data Completeness report.
- Consumption (feed-in for pure feed-in metering points) totals the current month and compares it with last year or the previous month; the power peak names the time and the metering point. While the month has only a few days, the Dashboard shows the previous month so a handful of days doesn't skew the figures.
- Consumption trend and Largest changes appear once measurement data exists. Each tile leads to the matching view in Energy Analysis.
Filter by customer
If you use customers, meaning your plan includes customer management and you have created at least one customer, a Customer field appears above the Dashboard. With a customer selected, every block shows only that customer's metering points, connections and exports. The selection is part of the page address: a link opens the view it names, and a link without a selection opens the whole team. It isn't saved.
Without a selection the Dashboard never adds customers together. When the metering points belong to several customers, a Customers table with one row per customer (consumption, power peak, completeness and open items) replaces the team's key figures. Customers with open items come first. Metering points without a customer form a row of their own.
If the selected customer has no metering point yet, the Dashboard offers to create a location or a metering point.
Data delivery
Every connection and scheduled export of your team gets a row with its state and a status line. A click opens the connection. Failing deliveries sit at the top, and a failure also raises a row under "Needs your attention".
| State | Meaning |
|---|---|
| Check mark | The latest delivery arrived. The status line gives the time and, for connections, the failed attempts of the last 24 hours. |
| Clock | Nothing has been sent yet. That doesn't prove the connection works. |
| Warning | The connection reports errors, or the export's latest delivery failed. |
| Cross | The connection switched itself off after persistent failures. |
| Pause | You disabled the connection or export yourself. |
For scheduled exports without errors, the status line also gives the day of the next send. Details on errors are in the delivery logs.
