Data Completeness
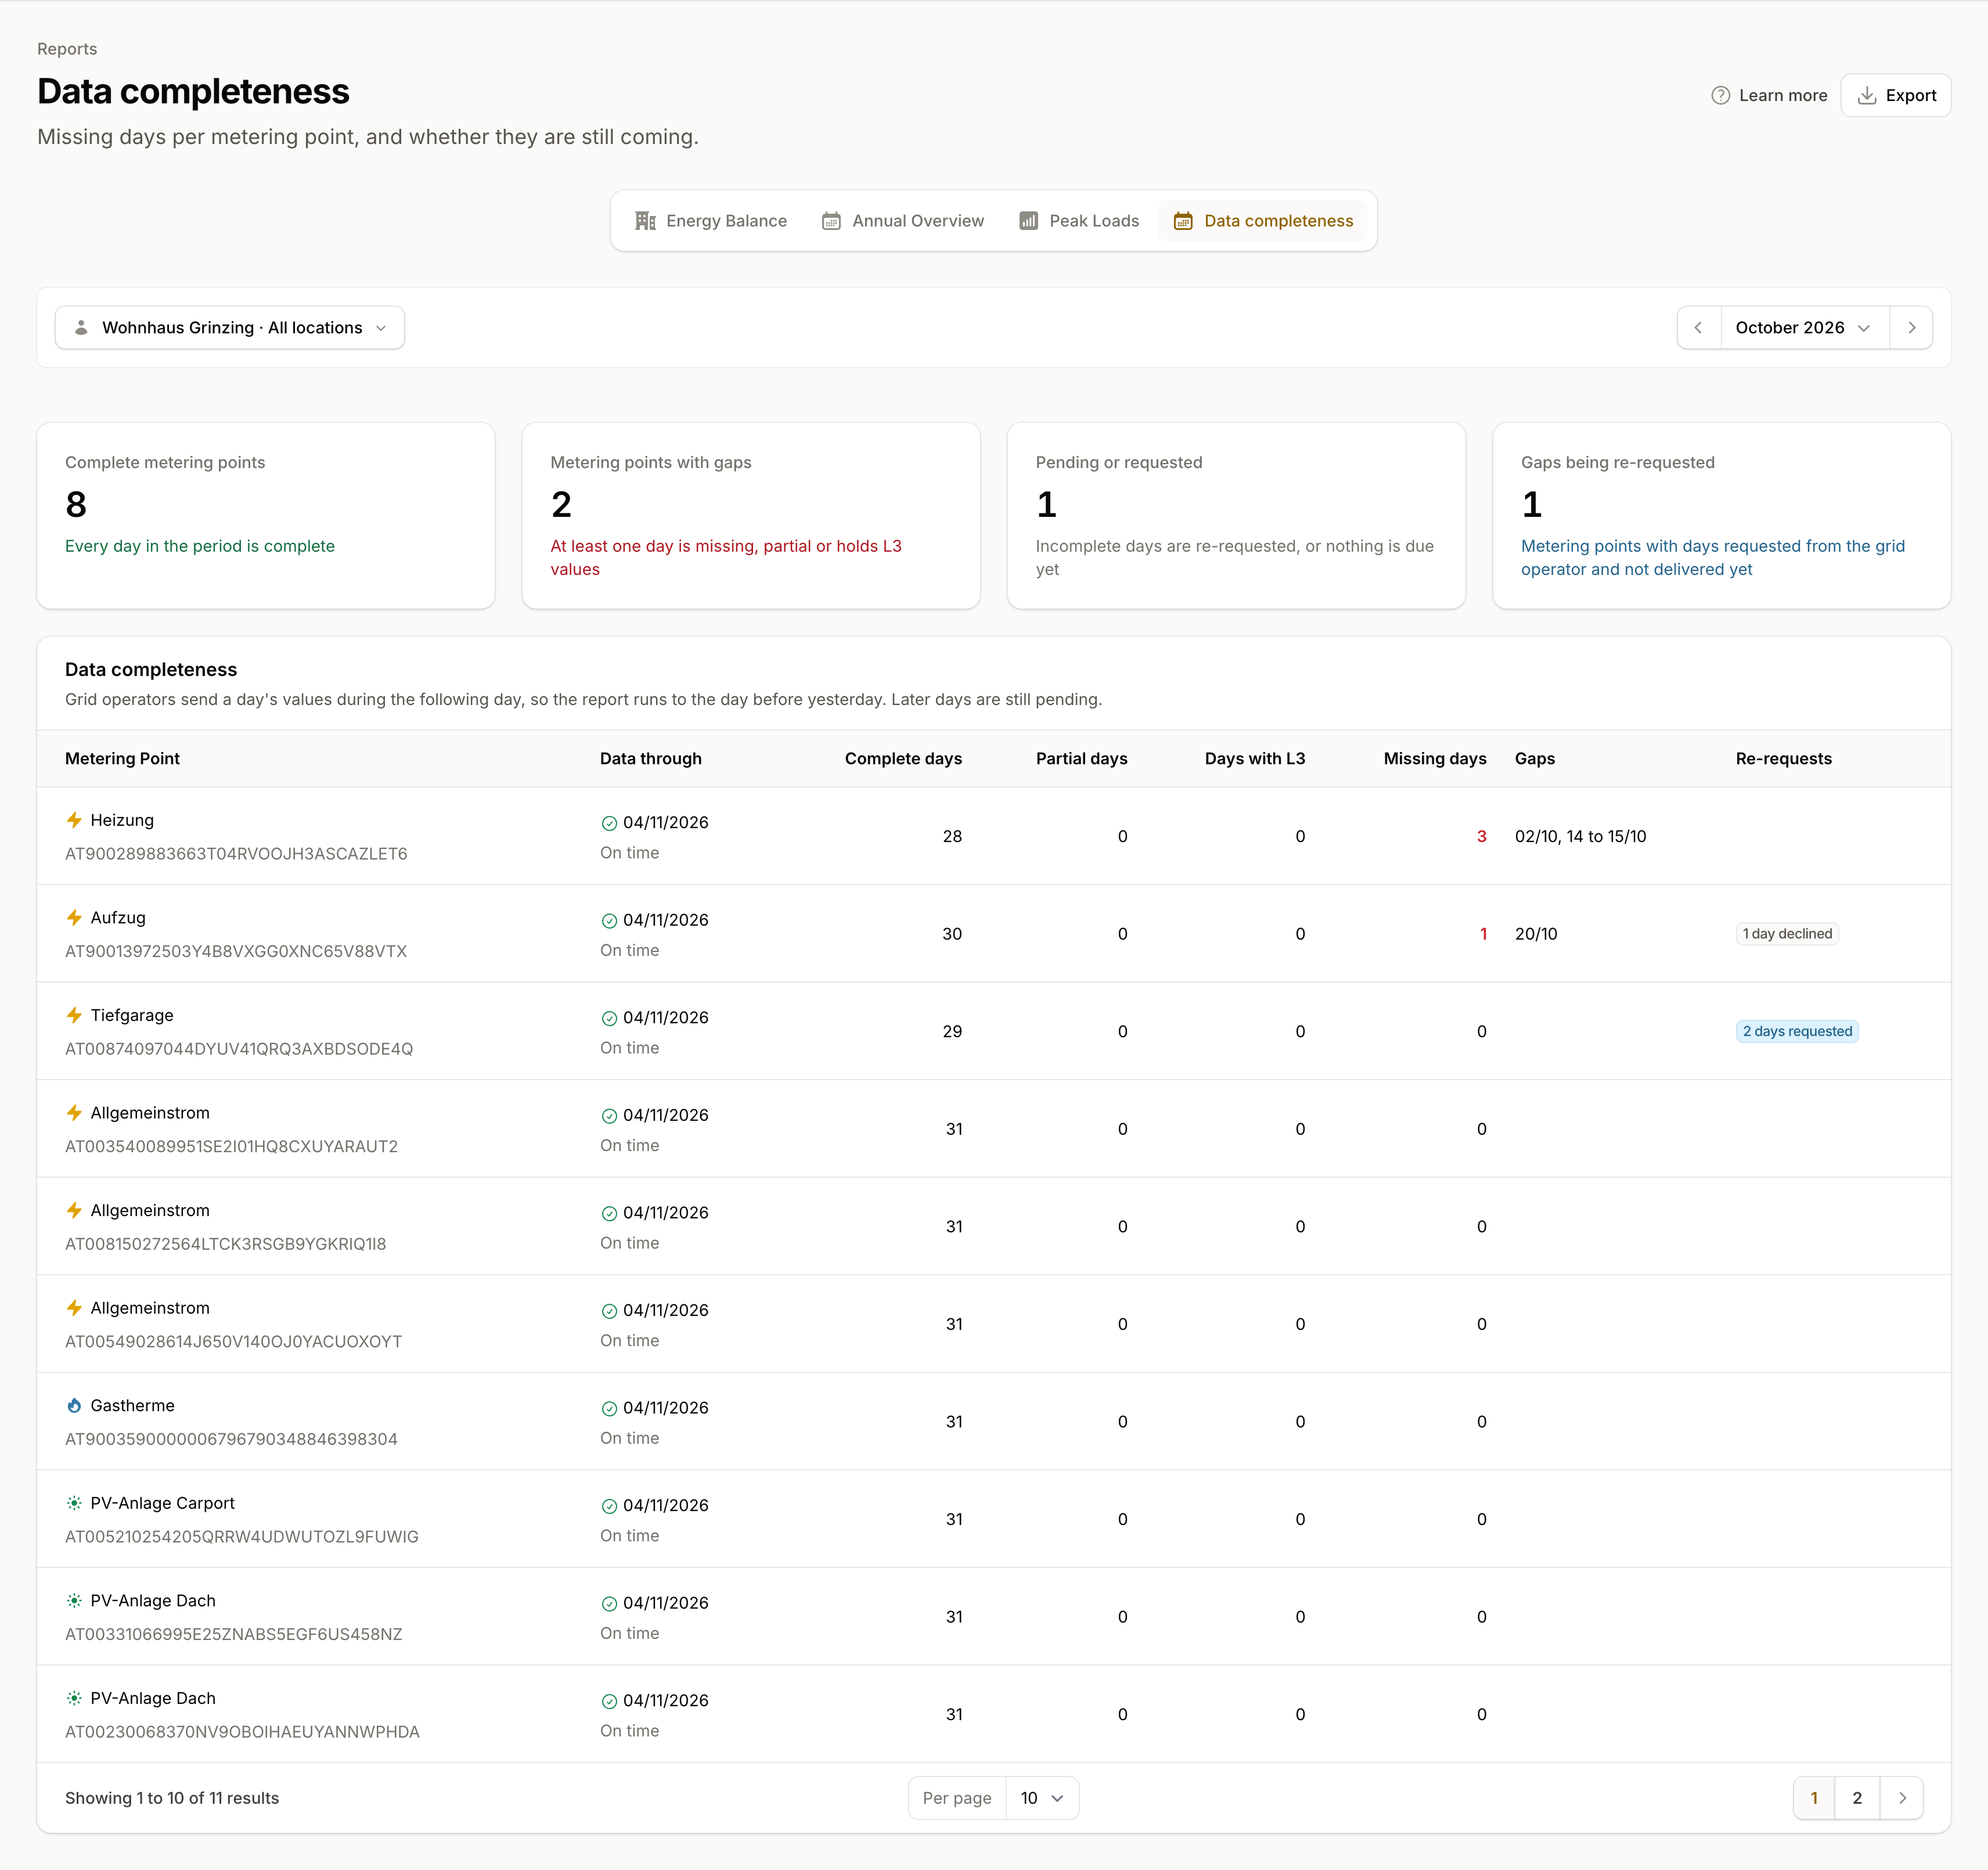
Data Completeness shows, for every metering point that delivers data, which days are missing in the period you choose. You see which gaps we have re-requested from the grid operator and can still arrive, and for which days the grid operator has declined. Before a settlement or an analysis, you know which figures you can rely on.
You find the page under Data → Reports → Data completeness. It is available on every plan, Community included.
Period and selection
Above the table you choose the period. Clicking the period opens the presets, and "Custom range…" lets you set your own start and end date. The report runs to the day before yesterday at the latest, because the grid operator delivers a day's values during the following day. Later days count as pending, not as gaps. The period applies to this page only.
Teams with location management (included from the Light plan) can also narrow the table to one location using the selection on the left, and teams with customer management (from the Plus plan) to one customer. Without location management the selection does not appear and the table shows all metering points of the team. If your team looks after meters of several customers, the page shows no table until you have picked a customer.
The figures at the top
Four tiles summarise the metering points:
- Complete metering points: Every day in the period is complete.
- Metering points with gaps: At least one day is missing, partial or holds L3 values, and no open re-request is bringing it in.
- Pending or requested: Incomplete days have been requested from the grid operator, or nothing is due yet.
- Gaps being re-requested: Metering points with days the grid operator has not delivered yet.
The columns
| Column | Meaning |
|---|---|
| Metering point | Label and metering point number. Clicking the row opens the Data coverage tab of the meter with its calendar. |
| Data through | The last day with values, with "On time" or "Late" below it. A meter still waiting for its first data shows "Awaiting first measurement data". |
| Complete days | Days on which all expected values are present (L1 or L2). Below, interruptions are listed if delivery stopped in between. |
| Partial days | Days on which only part of the expected values is present. |
| Days with L3 | Days holding unreliable substitute values. They are not billable, and the grid operator replaces them later. Projected days are counted separately below. |
| Missing days | Days without a single value. |
| Gaps | The missing days as date ranges. The first three are shown, the rest as "+n more". The export holds the full list. |
| Re-requests | How many days we have requested, whether historical data has been requested, and how many days the grid operator has declined. |
A meter that reports at irregular intervals has no expected number of values to measure a day against. Instead of "Complete days" it shows "Data on n days", and a day counts as soon as it has values. Rows are sorted by urgency, with the metering points with the most missing days first.
What a declined day means
When we re-request a day (see Automatic Data Retry), the grid operator can decline the request. The Re-requests column then shows, for example, "1 day declined". The day is still a gap and stays in the column it is in (Missing days, Partial days or Days with L3), and this request will get no further answer. Days the grid operator is still handling show as "n days requested" and do not count as missing. The data can still arrive later, for instance because the grid operator sends it on its own. A new request, or the day arriving, ends the declined state.
For days with a declined re-request, plan for a gap in your analyses. Where the result depends on them, contact the grid operator.
Exporting the figures
Use Export at the top right to download the table as CSV or XLSX. The file starts with the title, period, as-of date and the note about the report. Below it is one row per metering point with label, metering point number, location, data-through date, data status, the day counts, the missing days and the declined days. Unlike the table, the file spells out every date range of the gaps, with the year. The export follows the chosen period and the restriction to a location or customer.
Gas and electricity
Data Completeness covers electricity and gas metering points. The grid operator first sends the daily values of a gas month as L3 and replaces them with measured values once a month. Until then these days appear under Days with L3. When we re-request them is described under Automatic Data Retry.
