On this page
Understanding Your Energy Data
Data Analysis turns the raw data from your smart meter into meaningful insights. Instead of individual readings you see trends, patterns, and key metrics, so you can identify where you can save energy and costs.
The shared filter bar
All pages of Data Analysis share the same filter bar at the top:
- Select meters: Use the button at the top to choose which meters to analyse. You can look at a single smart meter or combine several, for example all meters at one location.
- Set time range: Switch between Day, Week, Month, Quarter, Year, and Custom. Use the arrows to step to the previous or next range. For a specific window, choose Custom and set a start and end date.
- Toggle direction: If a meter provides both consumption and feed-in, a toggle appears to switch between the two directions.
Charts always show data up to and including yesterday. Consumption values for the current day appear the following day, as data is transmitted overnight by the grid operator.
The sections of Data Analysis
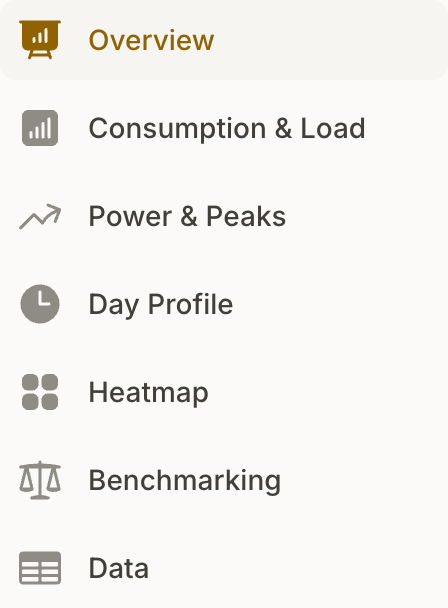
- Overview: Your most important metrics and data freshness. Your starting point.
- Consumption: How your consumption changes over time, as a load curve in kW or a consumption total in kWh, with comparison periods.
- Power: Load duration curve, base load, peak load, and your highest peaks.
- Energy communities: Your share supplied by energy communities. The section appears when we detect energy-community participation in the readings for one of your meters.
- Day Profile: The average daily curve, split by weekday and weekend.
- Heatmap: Your consumption by weekday and hour of day as a colour grid.
- Benchmarking: A comparison with typical values for your building type.
- Measurement Data: Your readings as a table, CSV download, and data quality.
Note: Power, Day Profile, and Heatmap require at least hourly values. If a metering point only delivers daily values from the grid operator, these pages stay in the navigation. They then show a notice or analyse only the part of the range for which finer values exist.
Next step
Start with the Overview. There you can see at a glance what your consumption looks like and where there is potential for optimisation.
