Consumption
The Consumption page shows your consumption history over time. Depending on the chosen time interval, the view switches between the load curve in kilowatts and the consumption total in kilowatt-hours.
Time interval and chart type
Above the chart you select the time interval. It also determines what the chart shows:
- 15 min and Hourly: the load curve as a line in kW. This is the power, meaning how much energy flows at each point in time. 15 min corresponds to the original data from your smart meter.
- Daily and Monthly: the consumption total as bars in kWh. Each bar represents the total energy for a day or month. Ideal for comparing weeks or months.
15-minute values are available up to a range of 14 days, hourly values up to 90 days. For longer ranges, use daily or monthly values. If a meter only delivers daily or hourly values, the finer interval is greyed out. Where values are missing in the period, we mark the gaps in the chart and note reduced completeness.
Comparing periods
With "Compare with" you overlay a second period on the first:
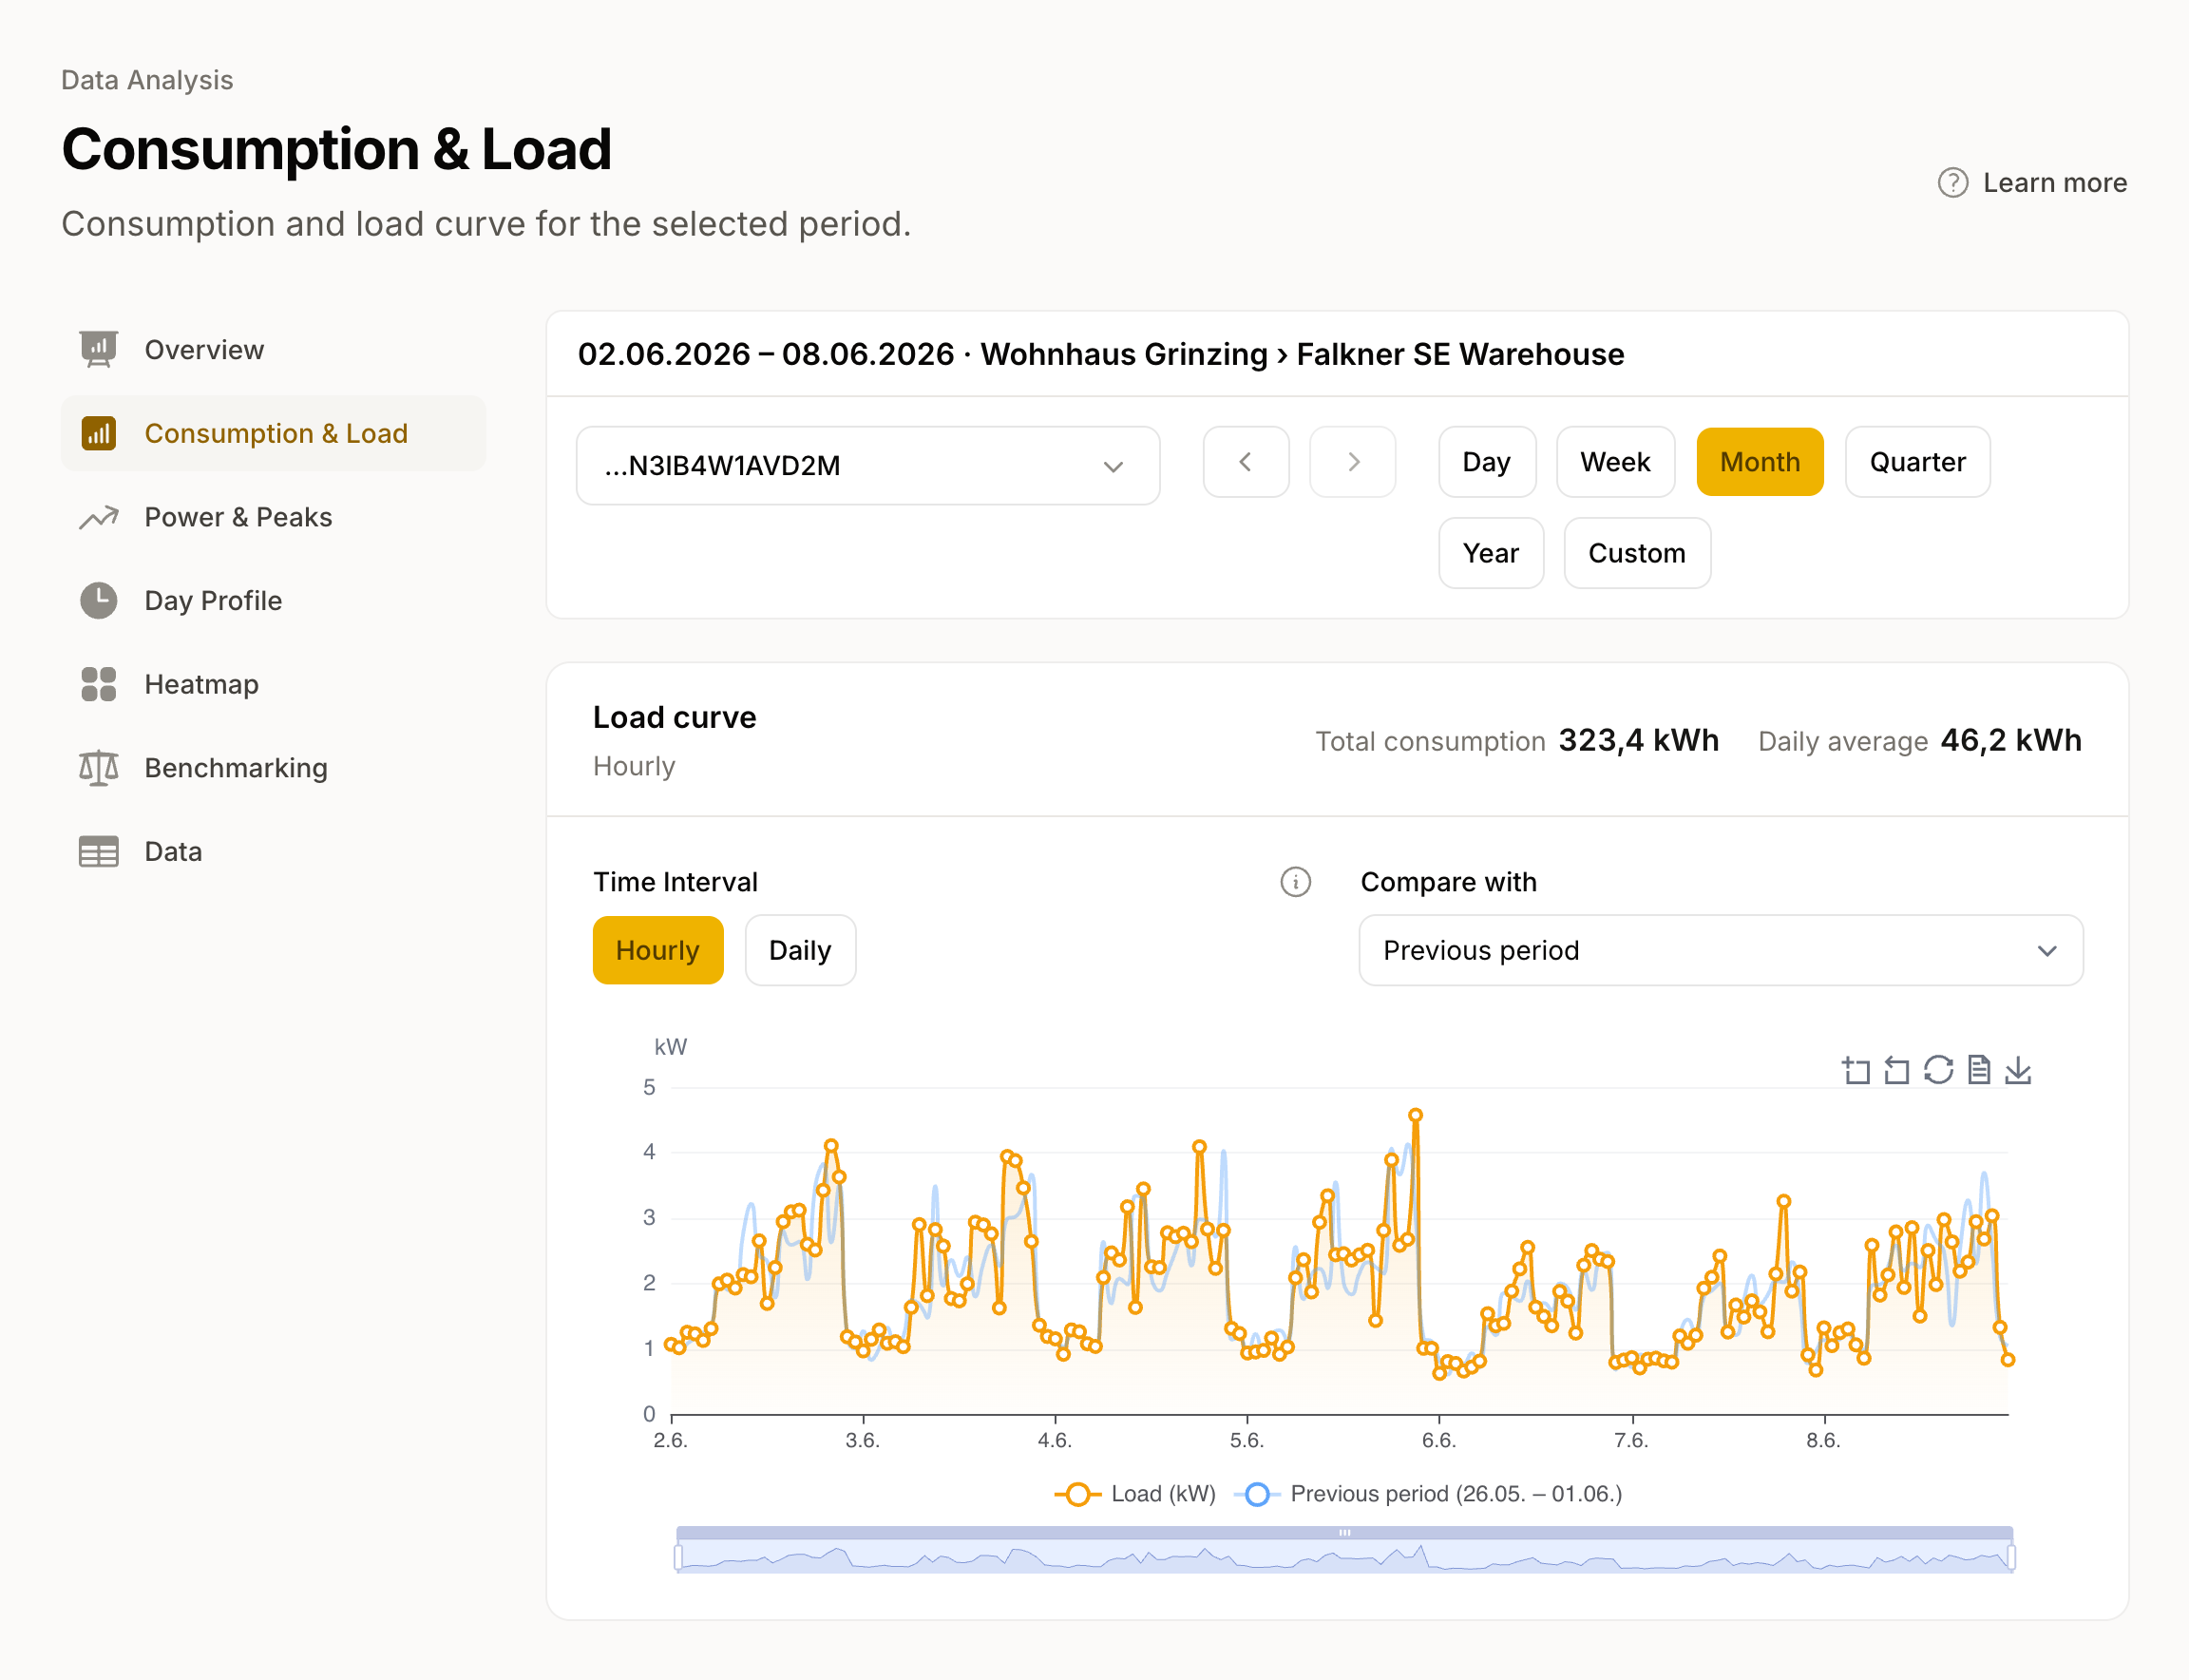
- Previous period: the equally long period immediately before.
- Same period last year: the same period in the previous year.
- Custom: any comparison period you set yourself.
This lets you identify changes, for example whether an optimisation measure actually reduced consumption.
Metrics and reference lines
Above the chart you see Total consumption (for feed-in meters: Total Feed-in) and Daily average for the period.
In the kW load curve, hovering reveals three reference lines: Average, Base load, and Peak. The full analysis of these values with the load duration curve is in Power.
How to use Consumption
- Compare totals: Switch to Daily or Monthly and compare week by week or month by month.
- Find outliers: Use daily resolution to look for days with unusually high or low consumption.
- Before and after: Use the comparison to check the effect of measures, such as new equipment or changed operating hours.
- Seasonal effects: Compare with the previous year to distinguish weather-related fluctuations from real changes.
For experts
The load curve provides measured quarter-hourly values (QH data), as opposed to the synthetic standard load profiles (SLP) that energy suppliers use for customers without a smart meter. These measured profiles are the basis for tariff optimisation because they reflect actual consumption behaviour.
For commercial customers with demand metering (RLM), QH data is also relevant for network tariff calculation: peak loads determine the demand charge, and the load curve determines the energy charge.
