Data
On the Data page you can view your measurement data as a table and download it as a CSV file. You can also see how reliable your data is.
Measurement data table
The table shows your readings with Meter, Timestamp, Measurement (OBIS code), Value (kWh), and Data Quality. The most recent values appear first by default. The filters above let you narrow down by location, meter, measurement, and data quality.
Export CSV
Click "Export CSV" in the header to download the measurement data for the selected period. The CSV file uses a semicolon as the delimiter and can be opened directly in Excel, Google Sheets, or your energy management system.
Data quality
Note: The data-quality donut chart is part of the advanced analysis, which is included from the Plus plan upwards.
The data-quality chart shows a donut chart of what share of your readings falls into each quality level:
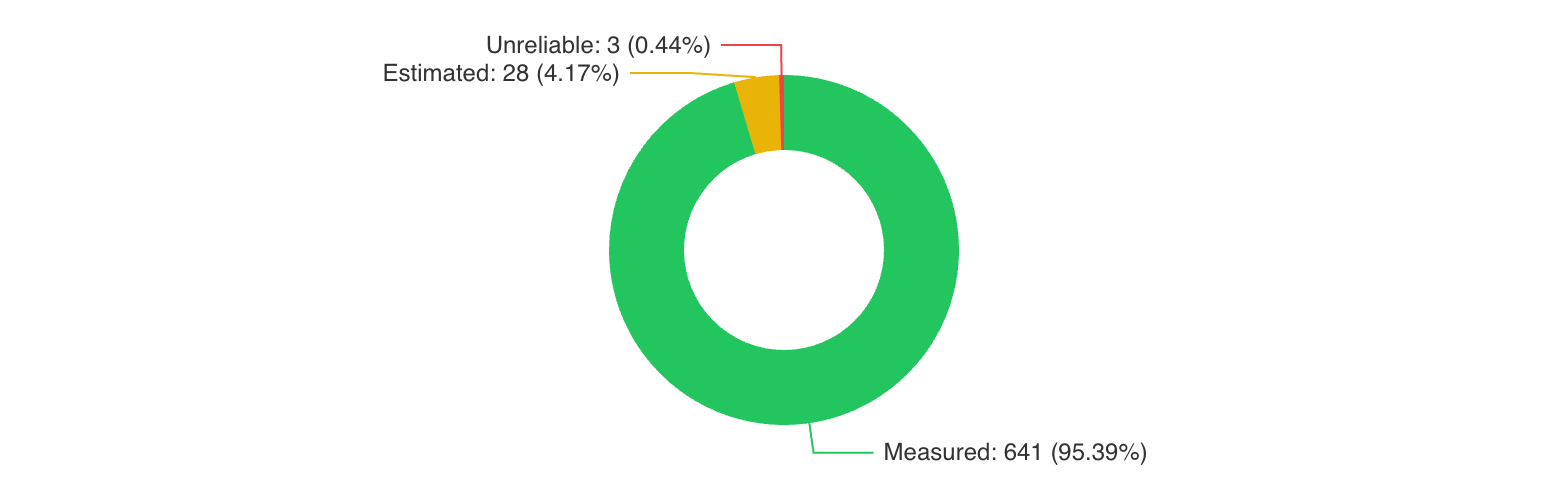
- Measured (L1, green): Actually measured values. This is the normal case. Aim for a share above 95%.
- Estimated (L2, yellow): Values estimated by the grid operator because the measured value could not be transmitted. Individual estimated values are normal and have little effect on the analysis.
- Unreliable (L3, red): Preliminary values with limited reliability, not suitable for billing. They are replaced by the grid operator with measured or estimated values within 60 days.
If your share of measured values is consistently below 95%, this may indicate a communication problem with the smart meter. In that case, contact your grid operator.
For experts
The quality levels (L1, L2, L3) follow the OBIS code conventions of the Austrian energy market. The exchange period for L3 values is 16 calendar days for energy communities and 60 days for general data exchange. L3 values must not be used for energy billing. After this period the grid operator replaces L3 values with measured or best-estimated values.
What do the OBIS codes mean?
Each reading carries an OBIS code that identifies what was measured. Most meters show only one or two codes:
- Grid consumption (
1-1:1.9.0 P.01): energy you drew from the grid. - Grid feed-in (
1-1:2.9.0 P.01): energy you fed into the grid. - Total consumption (
1-1:1.9.0 G.01): physical total consumption of the meter (EC members only). - Total generation (
1-1:2.9.0 G.01): physical total generation (EC members only).
Note:
G.01andP.01must not be added together. Their difference is the EC-allocated share, not an independent quantity.
All OBIS codes (for EC members)
| OBIS code | Description |
|---|---|
1-1:1.9.0 P.01 |
Grid consumption |
1-1:2.9.0 P.01 |
Grid feed-in |
1-1:1.9.0 G.01 |
Total consumption |
1-1:2.9.0 G.01 |
Total generation |
1-1:1.9.0 G.01T |
EC consumption (allocated) |
1-1:2.9.0 G.01T |
EC generation (allocated) |
1-1:2.9.0 G.02 |
EC generation share |
1-1:2.9.0 G.03 |
EC self-coverage |
1-1:2.9.0 G.03R |
EC self-coverage (renewable) |
1-1:2.9.0 P.01T |
EC surplus remainder |