Energy Balance
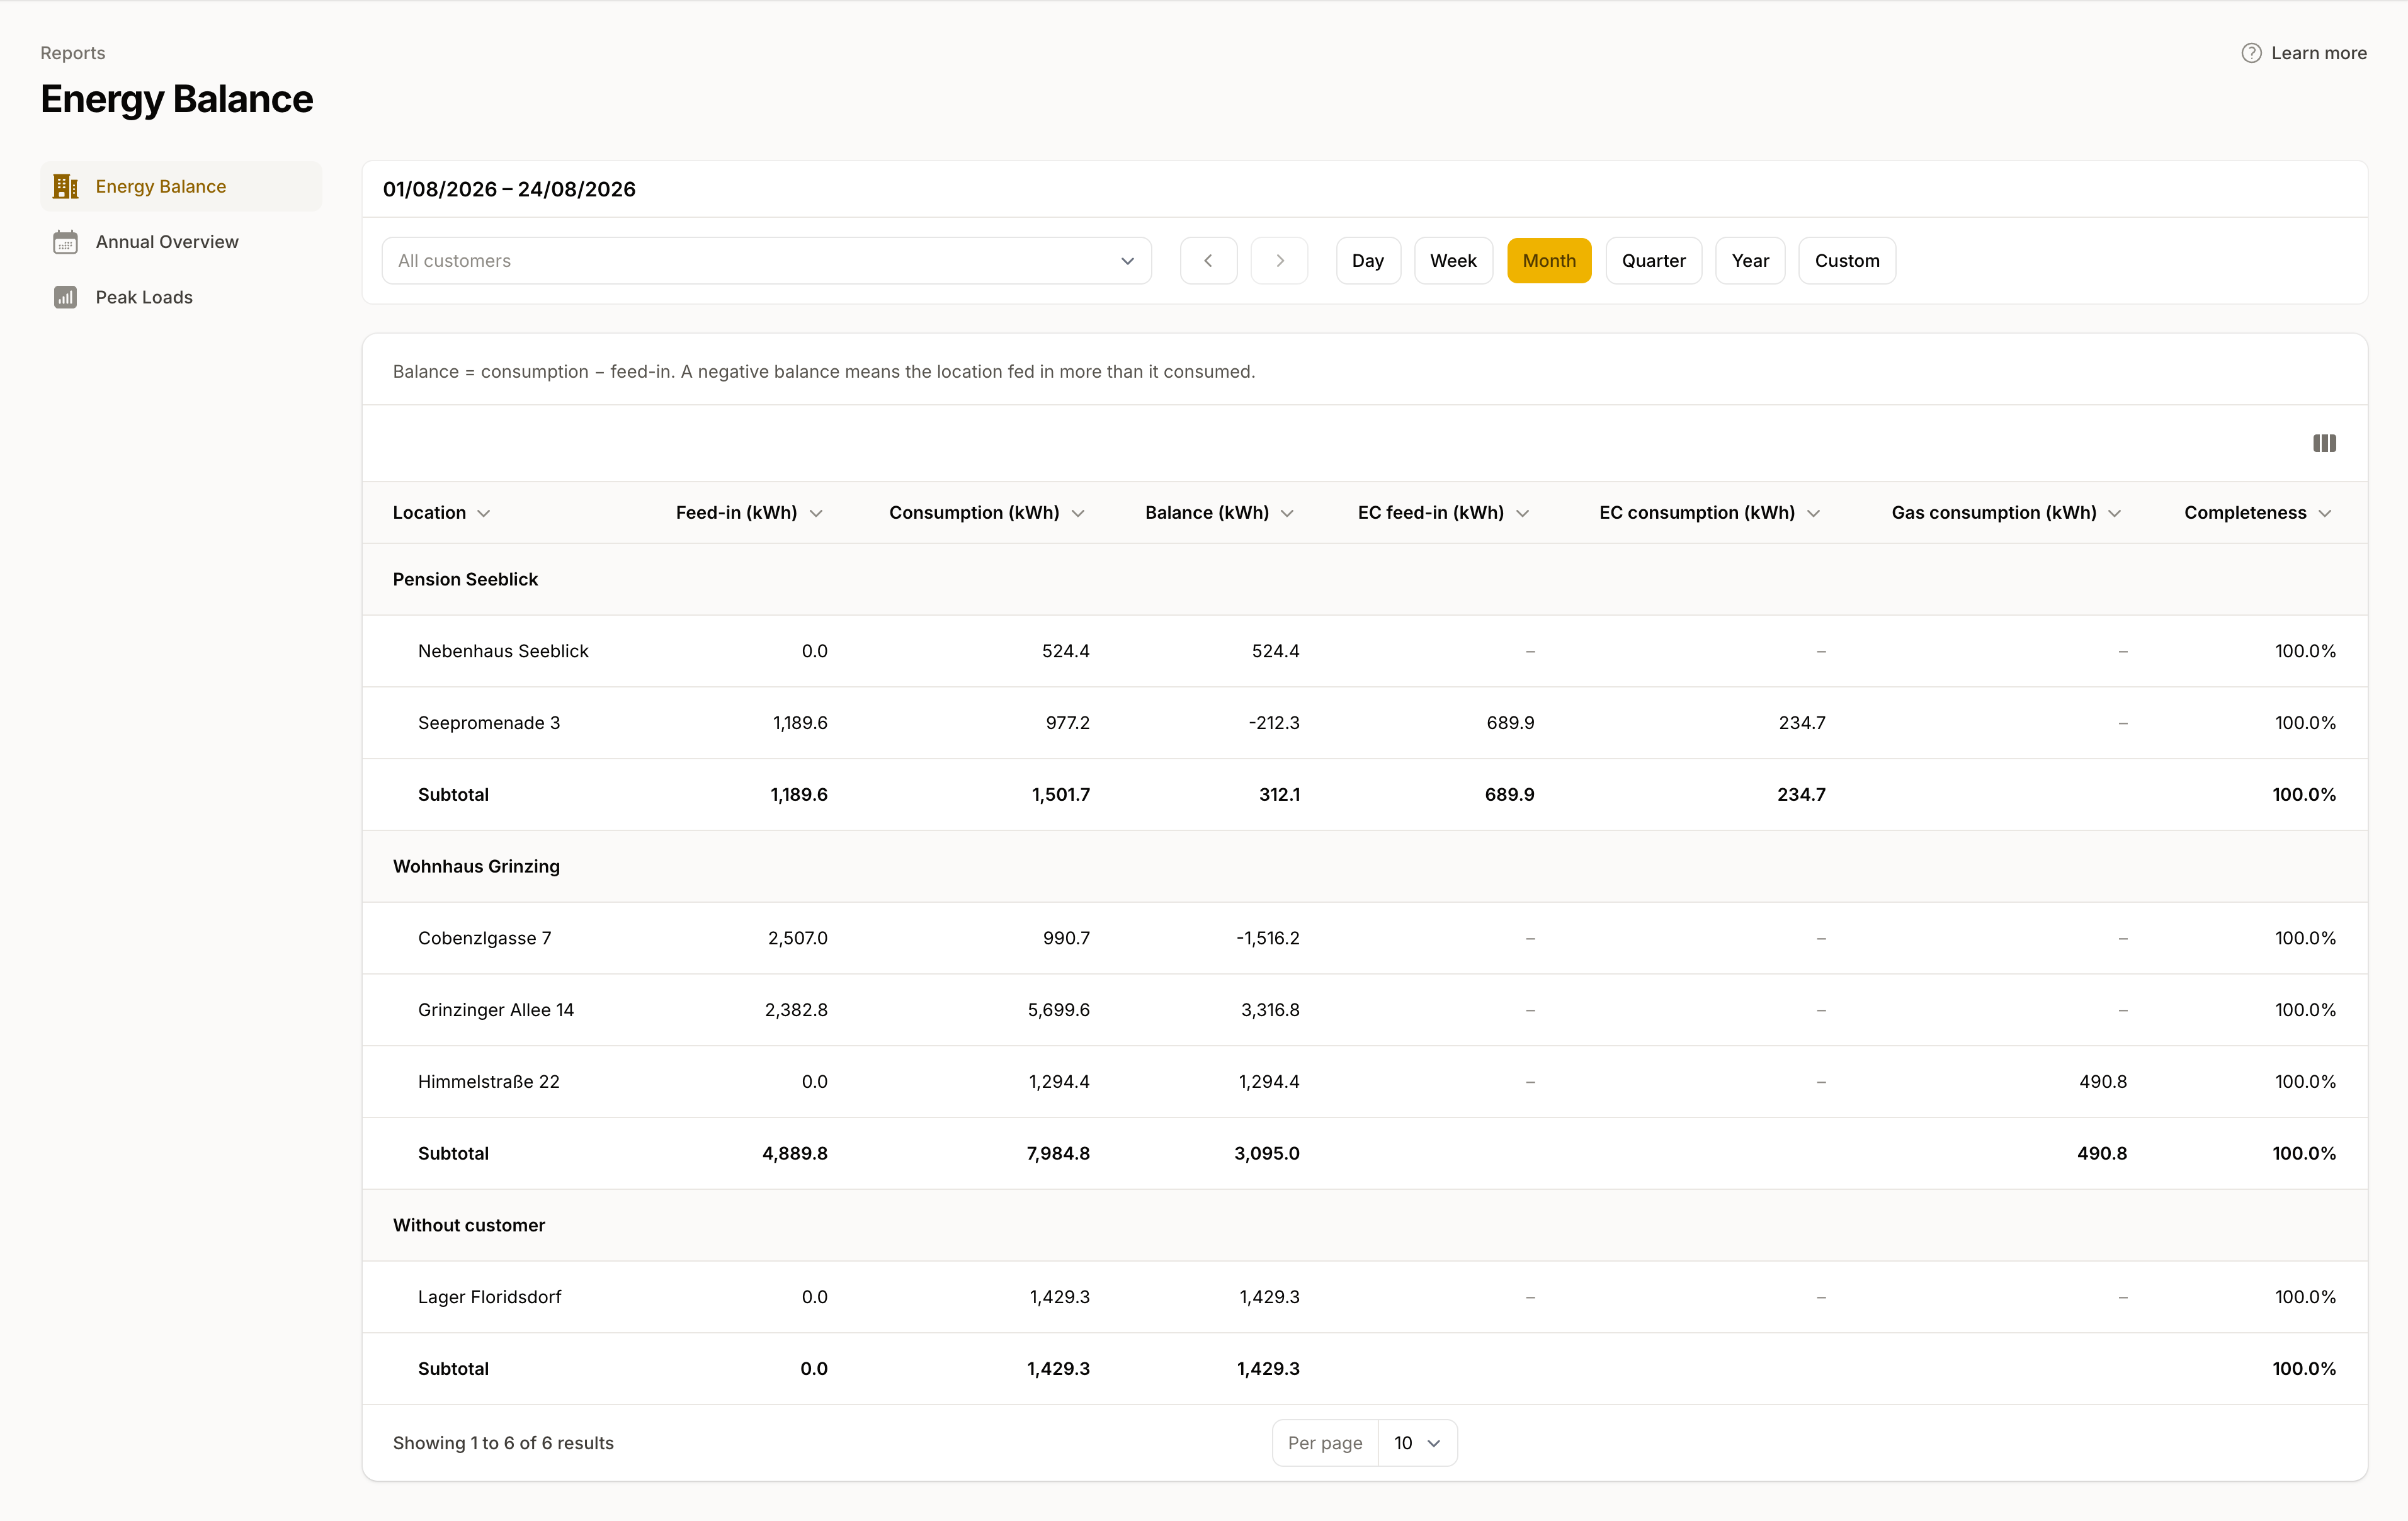
Energy Balance puts your locations side by side for one time range. One row per location, holding its consumption, its feed-in, and the balance between the two. It shows you which location buys energy in and which one gives back more than it draws.
You find the page under Data → Reports → Energy Balance.
Note: Energy Balance is included from the Light plan upwards. On the Community plan the page does not appear in the navigation.
Choosing a time range and a customer
The filter bar sits above the table:
- Time range: Day, Week, Month, Quarter, Year, or Custom with your own start and end date. Week and Month mean the current week and the current month so far. Use the arrows on the left to step to the previous or next range. The default is the widest of these your data already covers: usually the current month, or the current week or previous day for freshly connected metering points.
- Customer: Teams with customer management, included from the Plus plan upwards, can narrow the table to a single customer. With nothing selected the control reads "All customers".
The end date reaches yesterday at the latest. The grid operator transmits readings overnight, so values for the current day are not available yet.
The columns
| Column | Meaning |
|---|---|
| Location | Name of the location. The column menu also lets you show the address. |
| Feed-in (kWh) | What the location's meters delivered to the grid during the range. |
| Consumption (kWh) | What the location's meters drew during the range. |
| Balance (kWh) | Consumption minus feed-in. |
| EC feed-in, EC consumption (kWh) | The share that runs through an energy community. |
| Gas consumption (kWh) | The location's gas draw. |
| Completeness | Share of the expected readings that are present for the range. |
The two EC columns appear only when the selected range holds energy-community values. The gas column appears once one of the locations has a gas meter. Use the column menu at the top right to hide individual columns.
Reading the balance
Balance is the only signed column in the table: Balance = consumption − feed-in. A negative balance means the location fed in more than it consumed during the range. For locations with a PV system the balance often turns negative over summer and back again in winter.
The balance is a pure energy total across the range. It says nothing about whether generation and consumption happened at the same time. How well the two line up is what Consumption shows over time.
Customers, subtotals, and the grand total
If your team has customer management, the table groups by customer: a header row per customer, that customer's locations below it, then a subtotal. Locations with no customer assigned collect under "Without customer".
A grand total across all rows appears only in the ungrouped view, meaning when your team does not use customer management. Totals are deliberately never summed across customers. If you filter to a single customer the grouping falls away, since every row then belongs to that customer.
Missing values and completeness
A "–" in a location row means no values of that kind exist for the location in this range, for example because no meter of the matching direction is connected. Header rows, subtotals, and the grand total leave empty cells blank, so they read as summaries rather than as a location without data.
The Completeness column averages the data completeness of a location's meters across the range. When it sits well below 100%, readings are missing, and the totals beside it fall short of the real quantities by the same margin. To see which days are affected per meter, go to Measurement Data.
Taking the figures further
Energy Balance has no file export of its own. If you need the numbers outside the application, download the readings as CSV under Measurement Data, or have a closed period sent to you as a scheduled export.
