Peak Loads
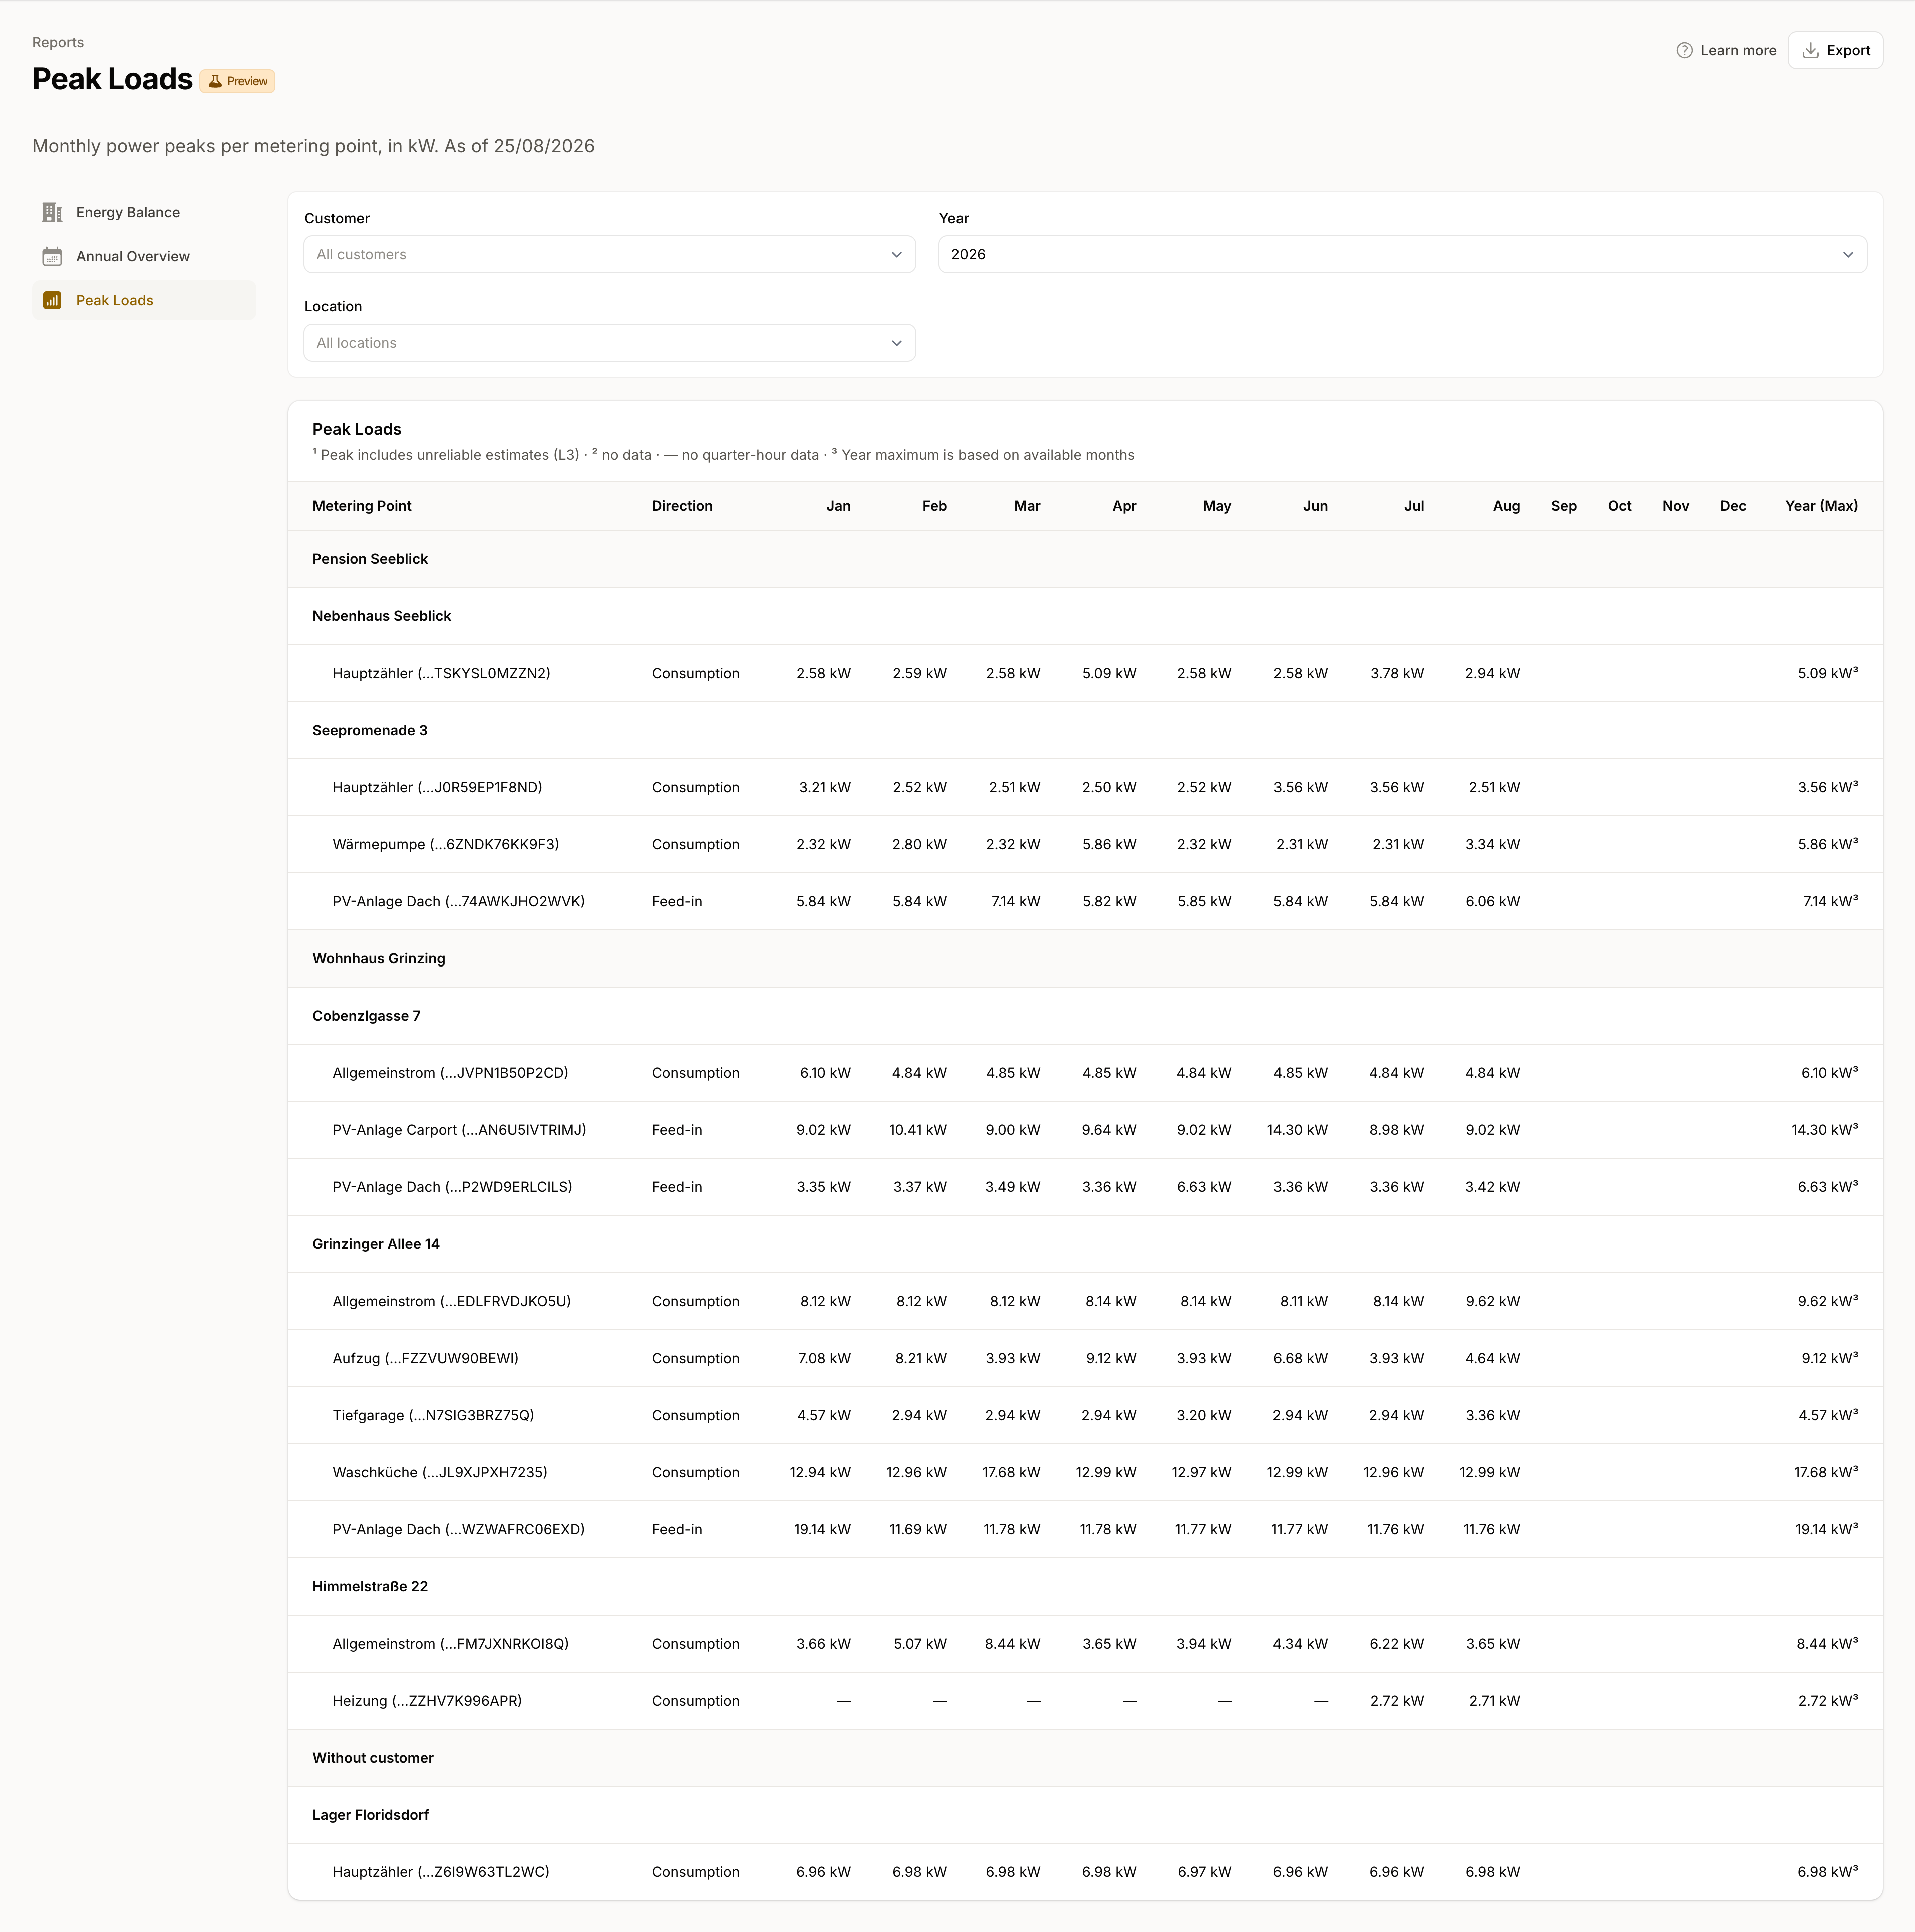
Peak Loads shows the highest measured power in kW per metering point and month. You can tell from it which metering points reach the highest levels, and whether the agreed connection capacity still fits.
You find the page under Data → Reports → Peak Loads.
Note: Peak Loads requires Advanced Analysis, included from the Plus plan upwards. On the Light plan the page sits in the navigation and describes what the report does in place of the table. On the Community plan it does not appear. The page currently carries a "Preview" mark, and its presentation may still change in coming releases.
What a peak is
The grid operator delivers quarter-hour readings in kWh. For every quarter hour of a month we convert that energy into the matching power, meaning times four, and take the highest of them. The March cell therefore holds the strongest quarter hour in all of March.
The Year (Max) column is consequently not a sum but the highest of the twelve monthly figures. That sets it apart from Annual Overview, whose year column adds the months up.
A peak needs quarter-hour data. Where a grid operator delivers only hourly or daily readings for a metering point, a quarter-hour peak cannot be derived from them.
Choosing a year, a customer, and a location
- Year: The list runs from the first year with readings up to the current one.
- Customer: Teams with customer management, included from the Plus plan upwards, can narrow the table to a single customer.
- Location: Narrows to one location. With a customer selected, only that customer's locations are offered.
How the table is built
The table breaks down by customer and location, with one row per metering point below. Consumption metering points come before feed-in ones, and within a direction they run alphabetically.
Each row names the metering point by its label and the last twelve digits of its metering point number. Labels are free text and repeat; the number is what makes the row unambiguous when you check against a grid invoice.
There are deliberately no subtotals here. Power peaks from two metering points cannot be added, because they may have occurred at different moments.
The report covers electricity metering points with the status "Connected".
The marks beside the figures
- ¹ Peak includes unreliable estimates (L3): The peak falls in a range holding provisional substitute values. L3 values are not billable, and the grid operator replaces them within 60 days. More on this under Key terms.
- ² no data: No readings exist for this month even though it has already passed.
- — no quarter-hour data: For this month the grid operator delivers a coarser resolution, so there is no quarter-hour peak.
- ³ Year maximum is based on available months: At least one month is missing, or the year is still running. A later month can still exceed the maximum shown.
An empty cell with no mark stands for a month still in the future.
Metering points without quarter-hour data
If a metering point delivers no quarter-hour readings across the whole selected year, it gets no row of twelve dashes. It is listed below the table instead: "Without quarter-hour data: …". That keeps the table on the metering points that have peaks to show.
The usual reason is the resolution the grid operator delivers for that metering point. Quarter-hour readings are available from your grid operator on request.
Exporting the figures
Export at the top right downloads the table as CSV or XLSX. The file opens with a header block of title, unit, cut-off date, and legend. Below it sits one row per metering point with location, metering point, direction, the twelve monthly figures, the year maximum, and a Notes column spelling out that row's marks. Metering points without quarter-hour data close the file as its last line.
How Peak Loads differs from load analysis
Peak Loads answers the question across your whole estate: one figure per metering point and month. To find out when exactly a peak occurred and how often similar levels came up, Load Analysis in Data Analysis is the place. It holds the load duration curve, the base load, and the individual highest peaks with their timestamps.
