Annual Overview
Annual Overview lays out a calendar year in twelve monthly totals, split per location into consumption and feed-in. Use it to fill in annual filings, to check a settlement against your own figures, and to see which months fall outside the usual range.
You find the page under Data → Reports → Annual Overview.
Note: Annual Overview is included from the Light plan upwards and currently carries a "Preview" mark. It is ready to use, and its presentation may still change in coming releases.
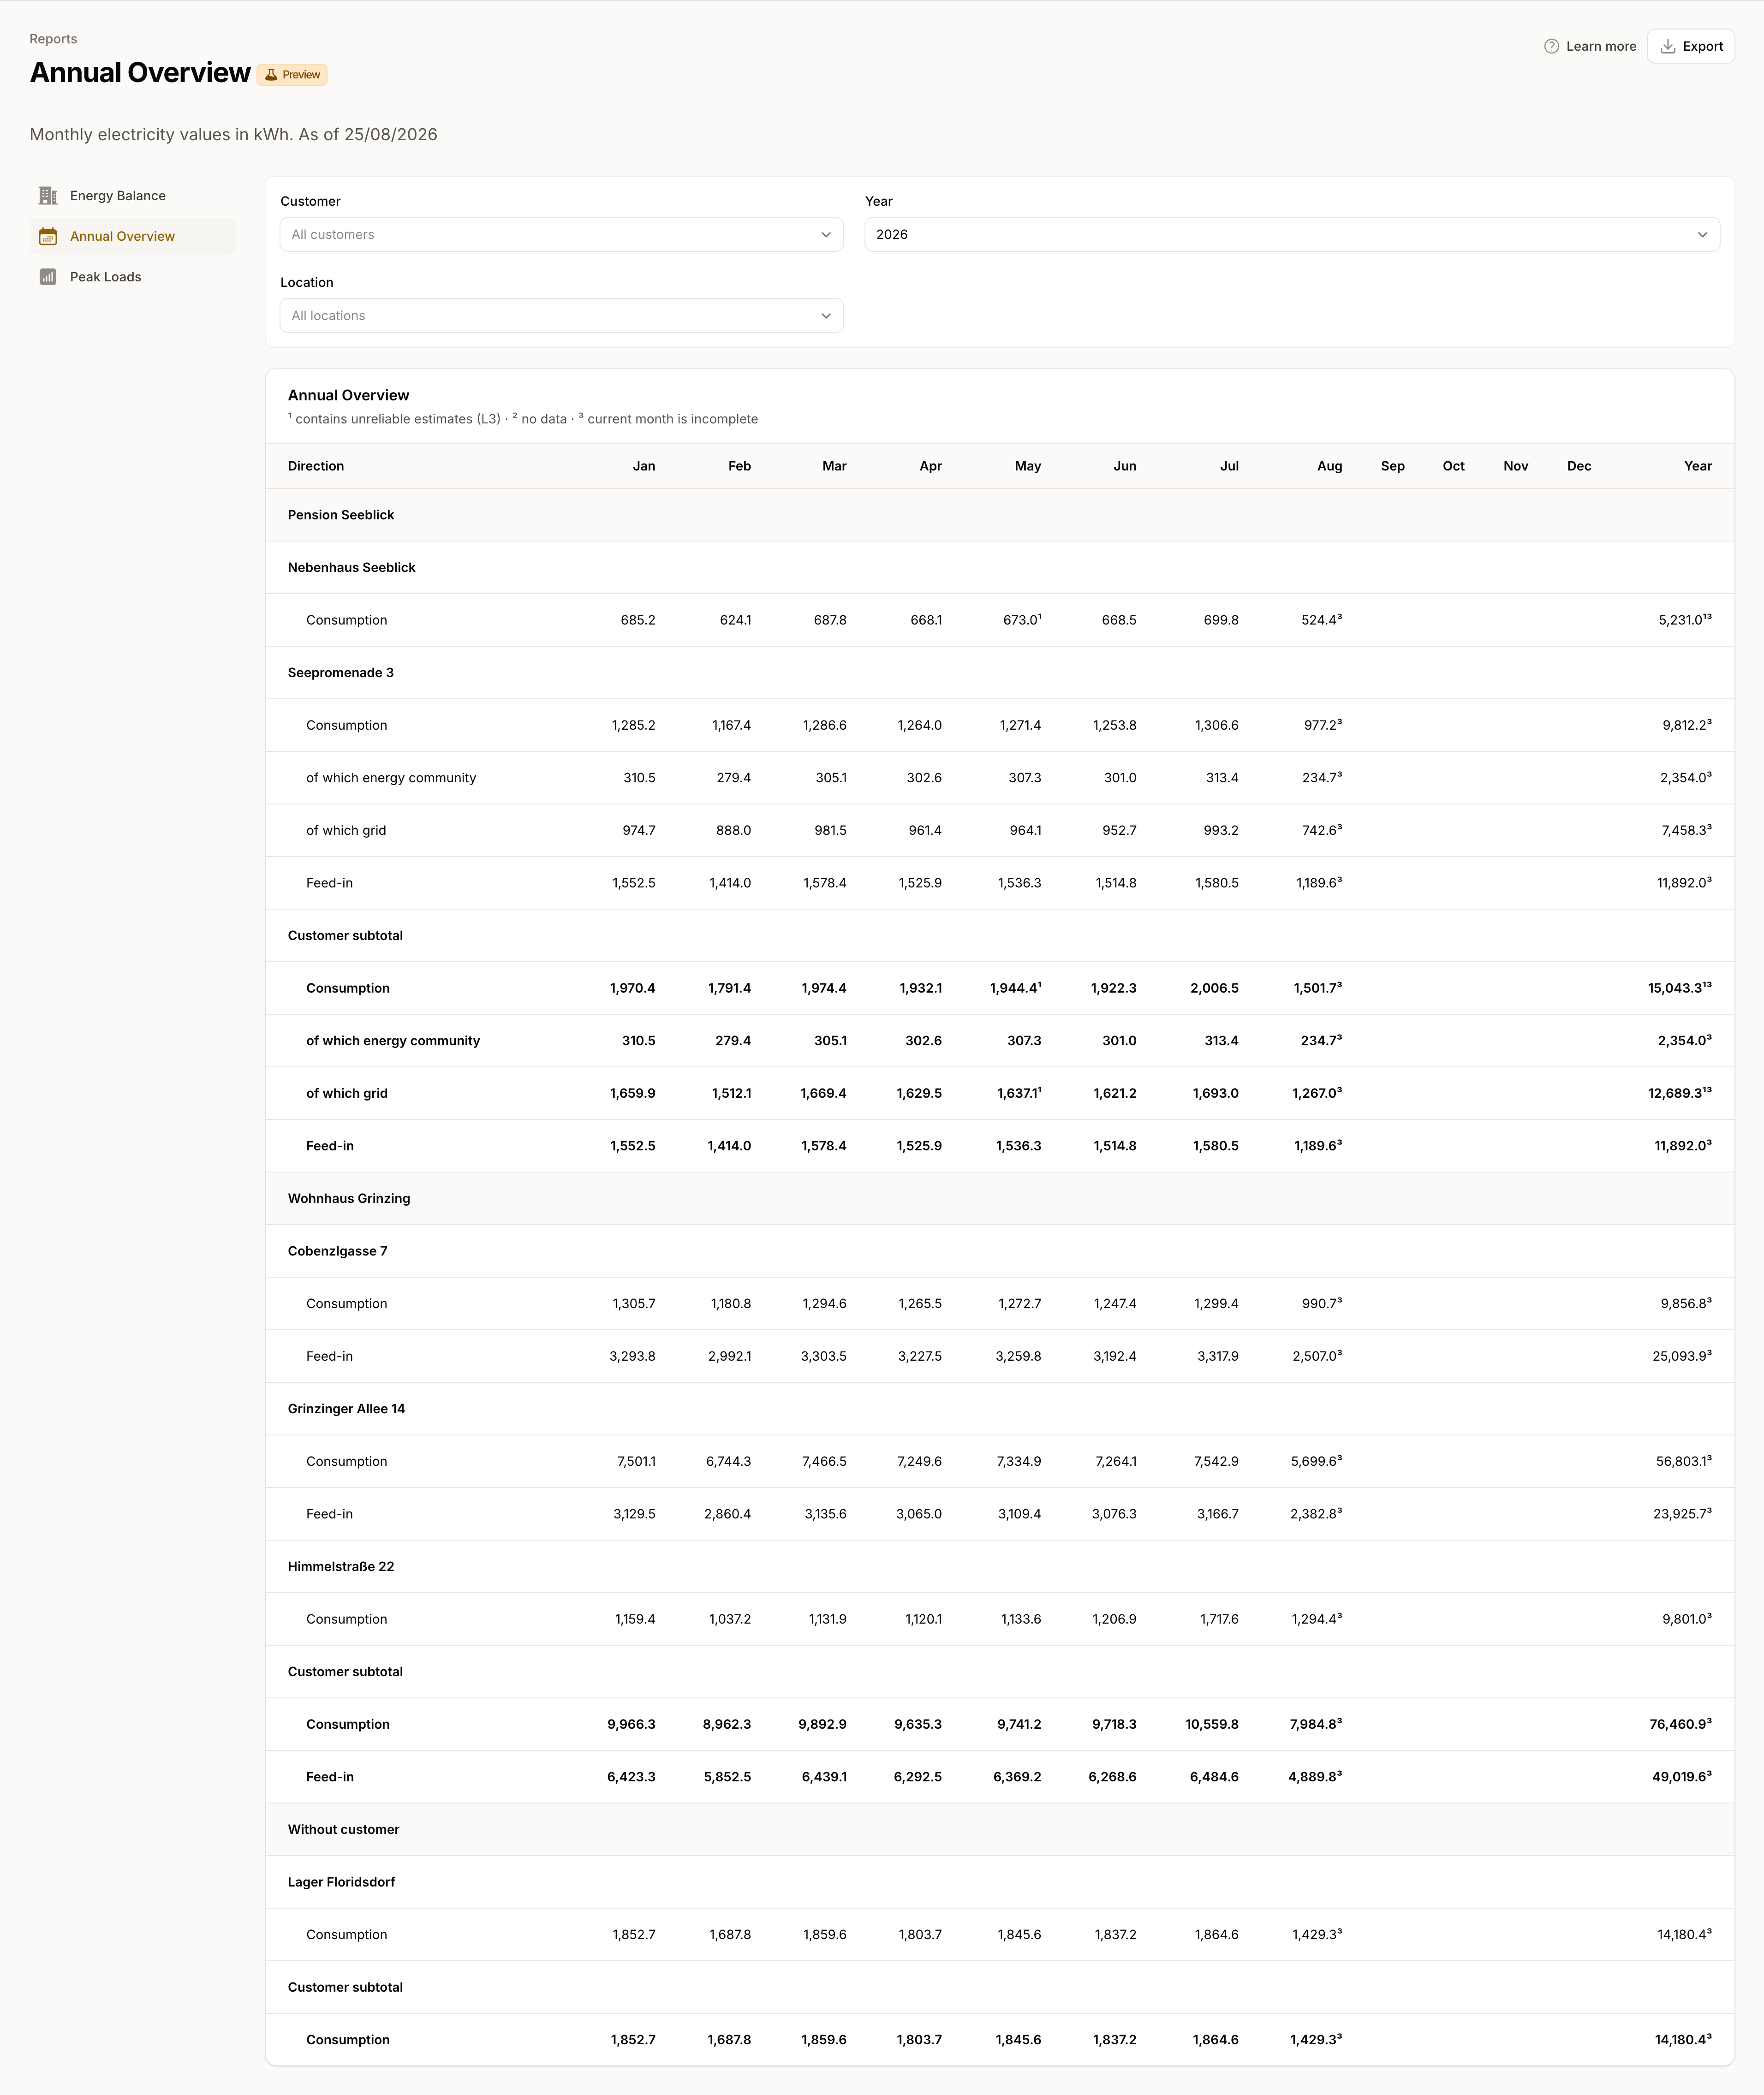
Choosing a year, a customer, and a location
The filters sit above the table:
- Year: The list runs from the first year with readings up to the current one. The current year is preselected.
- Customer: Teams with customer management, included from the Plus plan upwards, can narrow the table to a single customer.
- Location: Narrows to one location. With a customer selected, only that customer's locations are offered.
The page header names the cut-off, meaning the date up to which data can exist.
How the table is built
The table reads from the outside in: customer, then location, then that location's rows. Each customer block closes with a customer subtotal. If your team has no customer management, the customer blocks fall away and the table closes with one total across all locations.
Each location carries these rows:
| Row | Meaning |
|---|---|
| Consumption | What the location's consumption metering points drew, in kWh. |
| of which energy community | The share of consumption that came from an energy community. |
| of which grid | The remaining share drawn from the public grid. |
| Feed-in | What the location's feed-in metering points delivered to the grid, in kWh. |
A location only gets rows for the directions it is metered in, so a location without a PV system has no feed-in row. The two energy-community rows appear once the location drew energy from a community during the selected year.
The columns are the twelve month abbreviations followed by Year. The year figure is the sum of the twelve months.
Annual Overview covers electricity metering points with the status "Connected". Gas metering points stay out of it; their consumption appears in Energy Balance.
The marks beside the figures
A figure can carry superscript digits. They qualify the number rather than replace it:
- ¹ contains unreliable estimates (L3): At least one day in the range rests on a provisional substitute value. L3 values are not billable, and the grid operator replaces them within 60 days. More on this under Key terms.
- ² no data: No readings exist for this month even though it has already passed. To see which days are missing, go to Measurement Data.
- ³ current month is incomplete: The month is still running, so its total keeps growing.
A mark on a subtotal or total means it applies somewhere in the rows below it. An empty cell with no mark stands for a month still in the future.
Figures change retroactively once an L3 value is replaced. When you pass a figure on, carry the cut-off date from the page header with it.
Exporting the figures
Export at the top right downloads the table as CSV or XLSX. Both files follow the same structure:
- A header block with the title, the unit, the cut-off date, and the legend for the marks.
- The table, one row per location and direction. The customer column appears only in files from teams with customer management. Subtotals and totals sit in it as rows of their own.
- A "Qualifications" block at the end listing, per row, which month carries which mark.
The cells hold plain numbers. The marks move into the qualifications block so the file can be calculated with as it stands. The export keeps the customer and location you filtered to.
