Recognising Consumption Patterns
The Consumption Patterns page makes recurring structures in your consumption visible. Two views help you do this: the heatmap and the daily profile.
The heatmap
The heatmap shows your consumption on two axes: days (horizontal) and time of day (vertical, 00:00 to 23:00). The more intense the colour, the higher the consumption in that time slot.
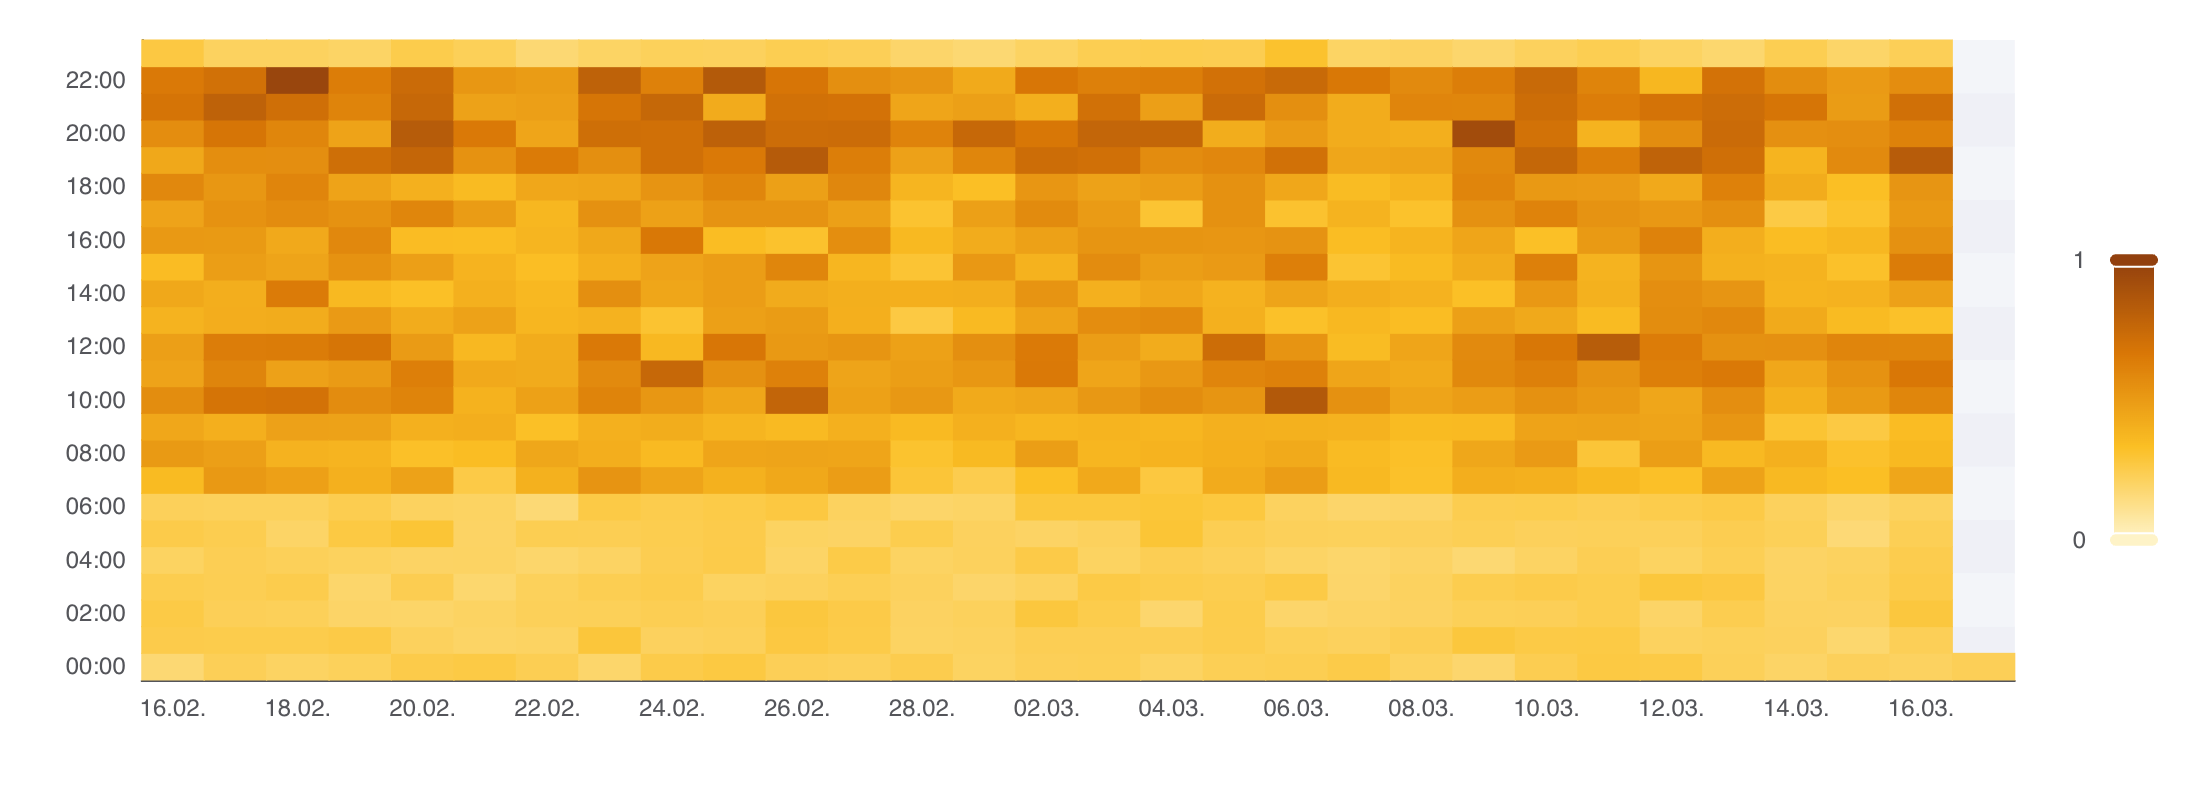
How to read the heatmap:
- Light cells = low consumption (e.g. at night, on weekends).
- Dark cells = high consumption (e.g. office hours on weekdays).
- Uniform columns = constant consumption throughout the day.
- High-contrast patterns = clearly defined usage times.
The daily profile
The daily profile shows average consumption per hour, separated by weekdays and weekends. This lets you see whether the consumption pattern on weekends differs from the weekday pattern and when consumption peaks occur.
How to use Consumption Patterns
- High night-time consumption: Check standby consumption, hot water storage, or heating circulation pumps. Devices running unnecessarily at night push up the base load.
- No difference between weekdays and weekends: In commercial buildings this can indicate a lack of time controls for heating, ventilation, or lighting.
- Irregular patterns: In residential buildings, irregular patterns are normal — consumption follows the daily routine of the occupants. In commercial buildings it is worth taking a closer look at operating hours.