The Load Profile
The Load Profile shows your consumption history as a time series. You can see how your load changes over hours, days, or weeks — and compare time ranges directly with each other.
Time resolution
Above the chart you choose the resolution:
- Quarter-hour (15 min): The original data from your smart meter — highest level of detail.
- Hour: Aggregated to hourly values — clearer for longer time ranges.
- Day: Daily values — ideal for weekly and monthly comparisons.
Comparing time ranges
The comparison feature overlays two time ranges:
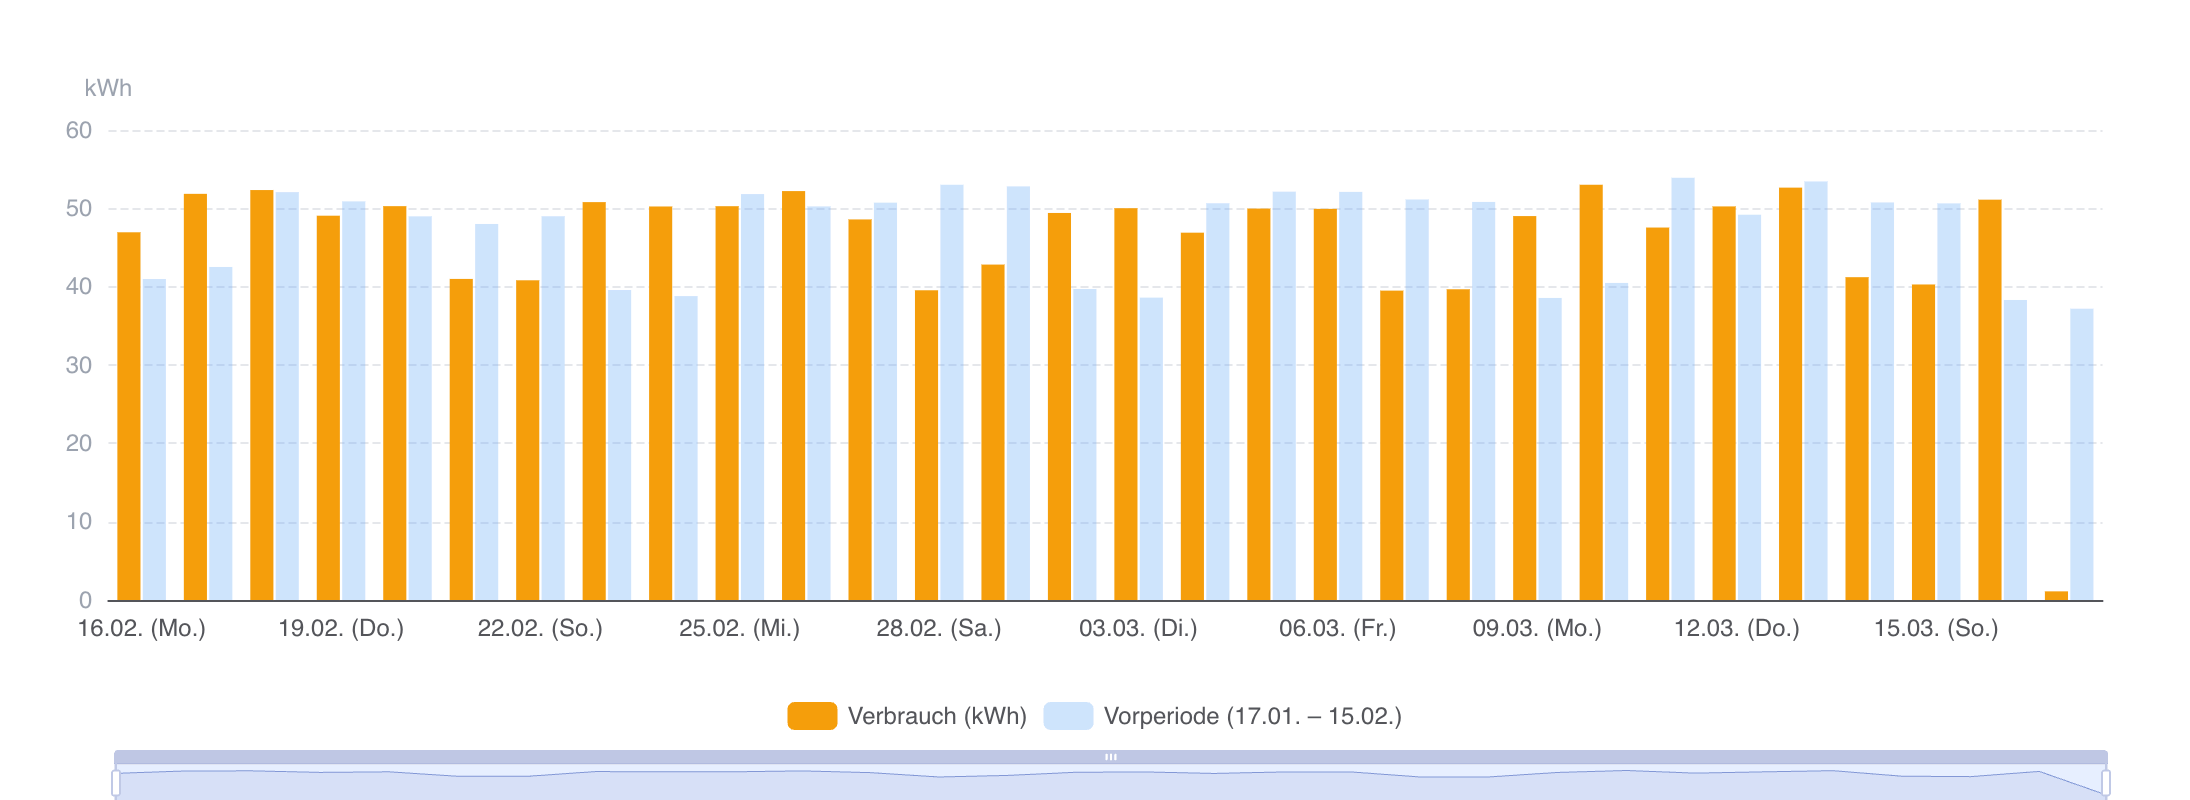
- Previous period: Compares with the equally long period immediately before.
- Previous year: Compares with the same period in the previous year.
- Custom range: Choose any comparison period you like.
This way you can identify changes — for example whether an optimisation measure actually reduced consumption.
Metrics for the time range
Above the chart you will see the metrics for the selected time range: total consumption, peak load, and average load. When a comparison is active, the values of both time ranges are shown side by side — with percentage change.
If your location has a standard load profile stored, an additional reference line is displayed in the chart. This lets you see how your actual consumption deviates from the statistical profile.
How to use the Load Profile
- Daily comparison: Switch to daily resolution and look for outliers — days with unusually high or low consumption.
- Before/after: Use the comparison to check the impact of measures (e.g. new equipment, changed operating hours).
- Seasonal effects: Compare with the previous year to distinguish weather-related fluctuations from real changes.
The Load Profile provides measured quarter-hourly values (QH data) — as opposed to the synthetic standard load profiles (SLP) that energy suppliers use for customers without a smart meter. These measured profiles are the basis for tariff optimisation because they reflect actual consumption behaviour.
For commercial customers with demand metering (RLM), QH data is also relevant for network tariff calculation: peak loads determine the demand charge, and the load curve determines the energy charge.