Load Analysis
Load Analysis shows how your load is distributed over the selected time range. The focus is on two metrics, the load duration curve and the highest load peaks.
Note: The load duration curve and the top peaks table are part of the advanced analysis and require a higher plan tier. The base load and peak load metrics are available on all plans.
Base load and peak load
At the top you will see two metrics:
- Base load: The minimum continuous power of your connection. It is calculated as the 5th percentile (P5) of the load duration curve — that is, the power value exceeded during 95% of the time. A high base load indicates devices running around the clock.
- Peak load: The highest measured value in the time range.
The load duration curve
The load duration curve sorts all readings in a time range from highest to lowest load. Here is how to read it:
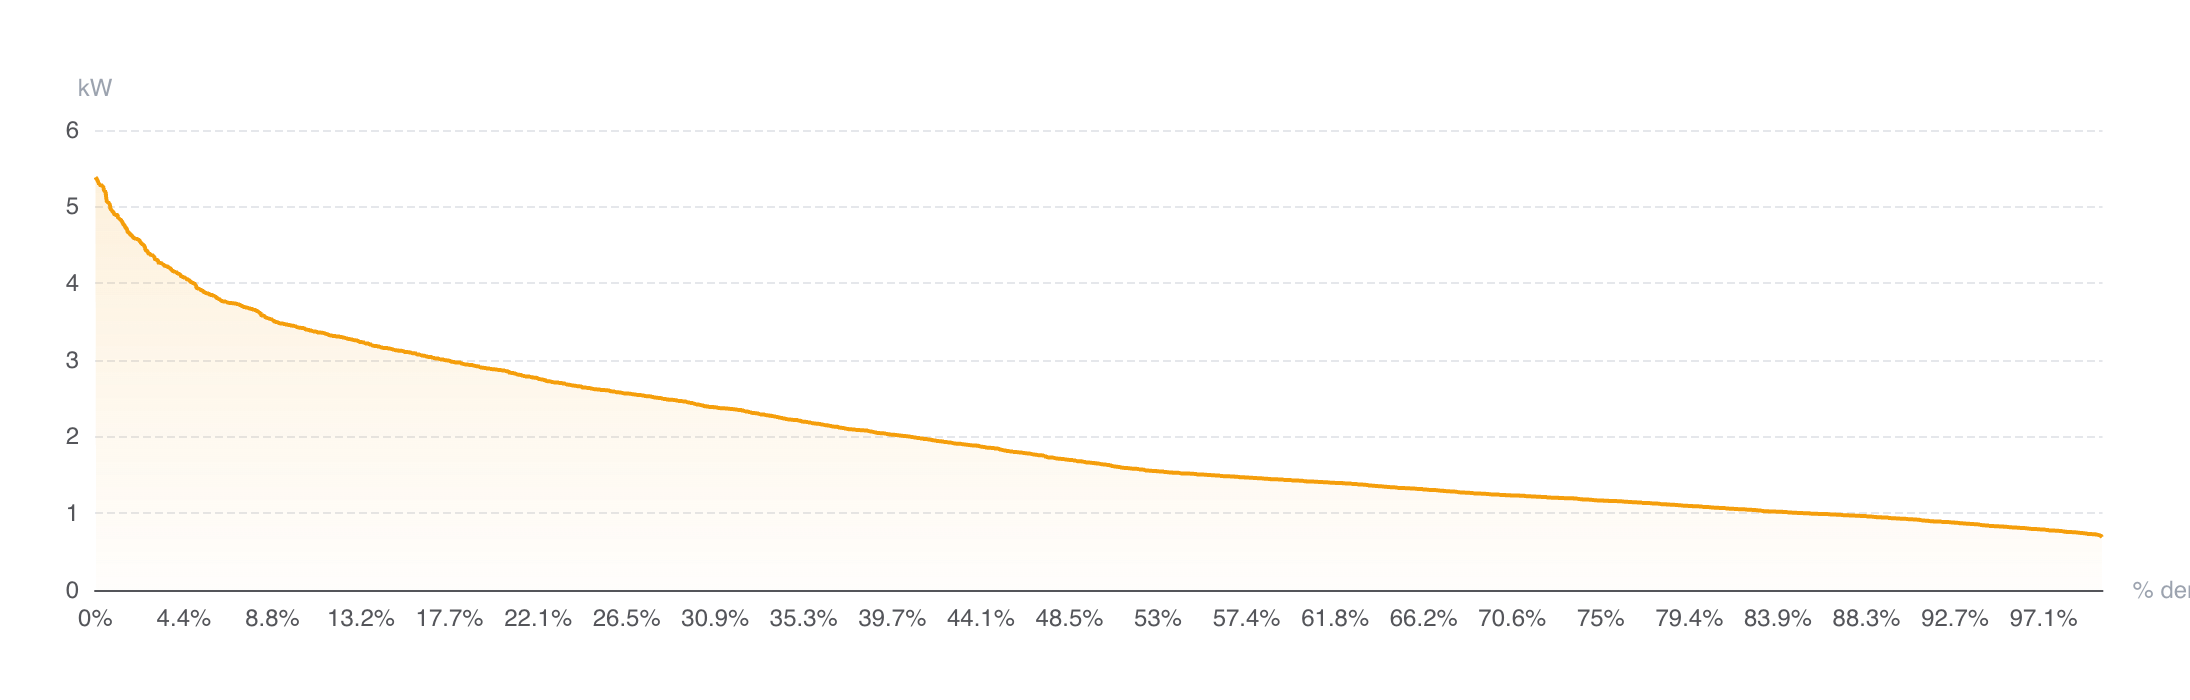
- Far left: Your peak load — the highest measured value.
- Far right: Your base load — the lowest continuous power.
- Steep curve: Your load fluctuates heavily — a few high peaks, then a rapid drop. Typical for buildings with individual large consumers.
- Flat curve: Your load is evenly distributed. Typical for buildings with a constant base consumption.
The area under the curve equals your total energy consumption in the time range.
Peak loads (Top Peaks)
Below the load duration curve you will see a list of the highest load peaks with exact timestamps. This lets you trace when the peaks occurred — and identify possible causes (e.g. devices switched on simultaneously, motor inrush currents).
The load duration curve is a standard tool in energy management. It helps with the assessment of:
- Peak shaving: Can load peaks be reduced by shifting or storage? The steeper the left flank, the greater the savings potential on demand charges.
- Demand-side management: What proportion of the load is shiftable? The range between the peak and median consumption shows the theoretical potential.
- Network tariffs: In Austria, the demand charge in the network tariff is based on the highest quarter-hourly average values. Targeted reduction of the top peaks can lower network costs.