Request a load profile and analyse it without Excel
You need the load profile of a metering point, the unbroken series of its quarter-hour values, and you want to read from it how high the base load sits, when the peaks come and which patterns keep repeating. That data already exists, and for commercial connections it is usually held in 15-minute resolution. The effort lies elsewhere: a single meter produces around 35,000 values a year, every grid operator runs its own portal and its own export format, and with more than 140 grid operators in Austria, collecting the data alone takes the most time. This post shows how you request a load profile, at which resolution it arrives, and how you analyse it instead of building it up by hand in a spreadsheet.
What a load profile is and why Excel breaks down on it
An electricity load profile is the time series of a metering point's quarter-hour values: a reading every 15 minutes, day and night. That comes to 96 values a day and around 35,000 a year (96 a day over 365 days). For one meter and one month it stays manageable. For one meter and a full year it is 35,000 rows, and for a portfolio of a dozen metering points the file moves beyond what a spreadsheet can still sort, filter and compare.
Why this resolution at all? Because only the 15-minute values show what happens between the monthly readings: the night load, the load peak on Tuesday morning, the consumption outside operating hours. How this resolution became the legal standard is covered in our post on quarter-hour values in the ElWG.
Requesting the load profile: the routes at a glance
Two routes lead to the load profile. Which one fits depends on how many metering points you look after and across how many grid areas they are spread.
Through the grid operator portal
Every grid operator runs a portal with a login and a data export. There you download a metering point's load profile as a CSV. For business customers with many metering points there are sometimes dedicated access points: Wiener Netze, for instance, runs a separate business portal built for exactly this case. The catch shows up as soon as your metering points sit in several grid areas. Then each grid operator means another portal, another login and another export format that you have to merge with the rest. Which resolution the export comes in depends on the meter (more on that shortly).
Through a service with an EDA connection
The second route bundles the grid operators behind a single connection. The metering point owner releases the data once in their grid operator's portal; after that the values come in daily (T-1) across all grid areas in one uniform format. The release itself stays a manual step for the metering point owner, the rest runs over the EDA network. A detailed comparison of the methods, with and without your own connection, is in our guide to reading out smart-meter data.
Which resolution you get
Whether a meter delivers quarter-hour values or only daily values depends on its configuration. For most commercial metering points the question is already settled: connections with PV feed-in, a heat pump, battery storage, a charging point or a dynamic electricity contract carry quarter-hour values, because the ElWG (§ 54) denies them the transition period with daily values.[1] For smaller consumption points this period is phased out in stages: daily values are permitted until 31 December 2026 at an annual consumption up to 5,000 kWh, and from 1 January 2027 only up to 1,500 kWh.
For data access a second rule applies. Once the metering point owner releases the data to a third party, that third party receives the values at the finest available resolution. A separate opt-in for granularity is no longer needed since the ElWG (§ 58).[2] The release stays the precondition: it decides whether you get the data, and the resolution then follows from the meter.
Why Excel hits its limit with several meters
With one meter, analysis in a spreadsheet still works. From the second meter on the problems begin, and nearly all of them are organisational.
- Every grid area brings its own access and its own export format. Column order, timestamps and separators rarely match, so time goes into aligning them.
- An export is a snapshot. Next month you download again, and the new values have to join onto the old ones.
- Then there is the size: 35,000 rows per meter and year. With a dozen metering points that quickly becomes hundreds of thousands of rows, which a spreadsheet will open but barely process smoothly.
None of this is unsolvable. But it is recurring manual work that grows with every metering point and every month.
Analysing the load profile: what matters
A load profile only tells you something once you analyse it. Three angles cover most of the questions.
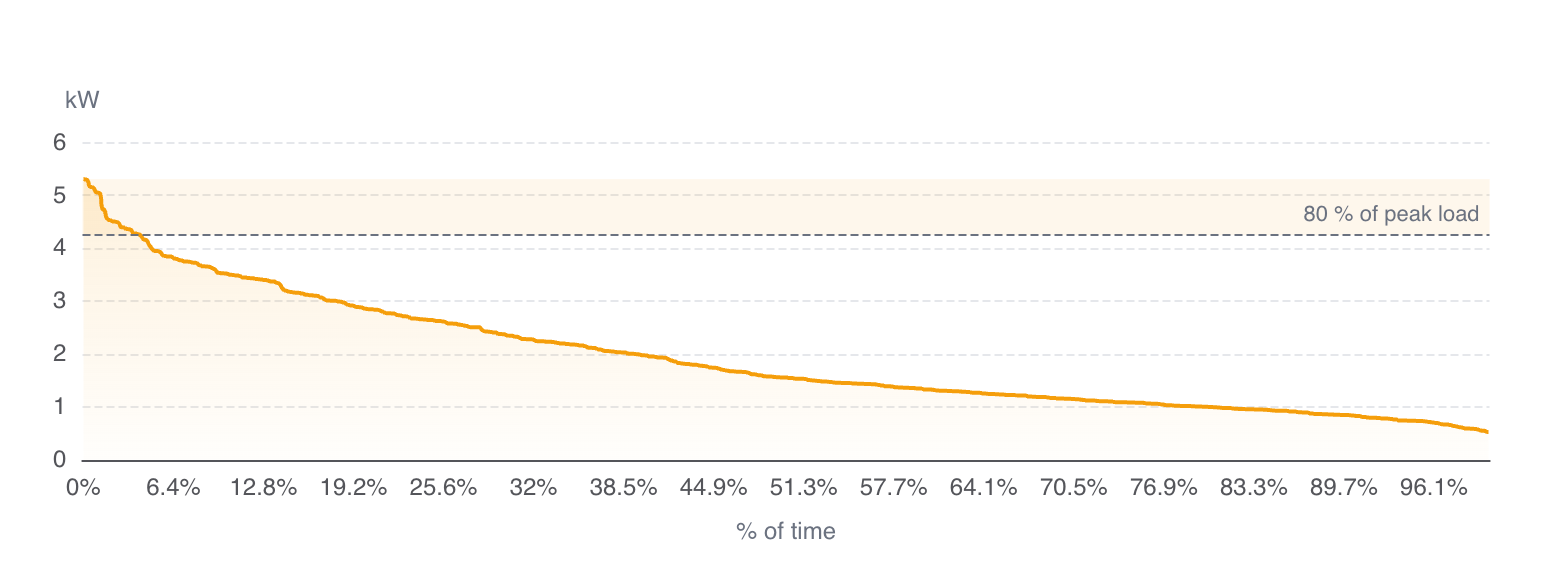
Base load and peaks. The load duration curve sorts every quarter-hour of a year by height and shows at a glance how much load runs permanently and how often it heads towards a peak. The highest quarter-hours stand next to it with their time and value, which answers the question of when exactly the expensive peaks occur.
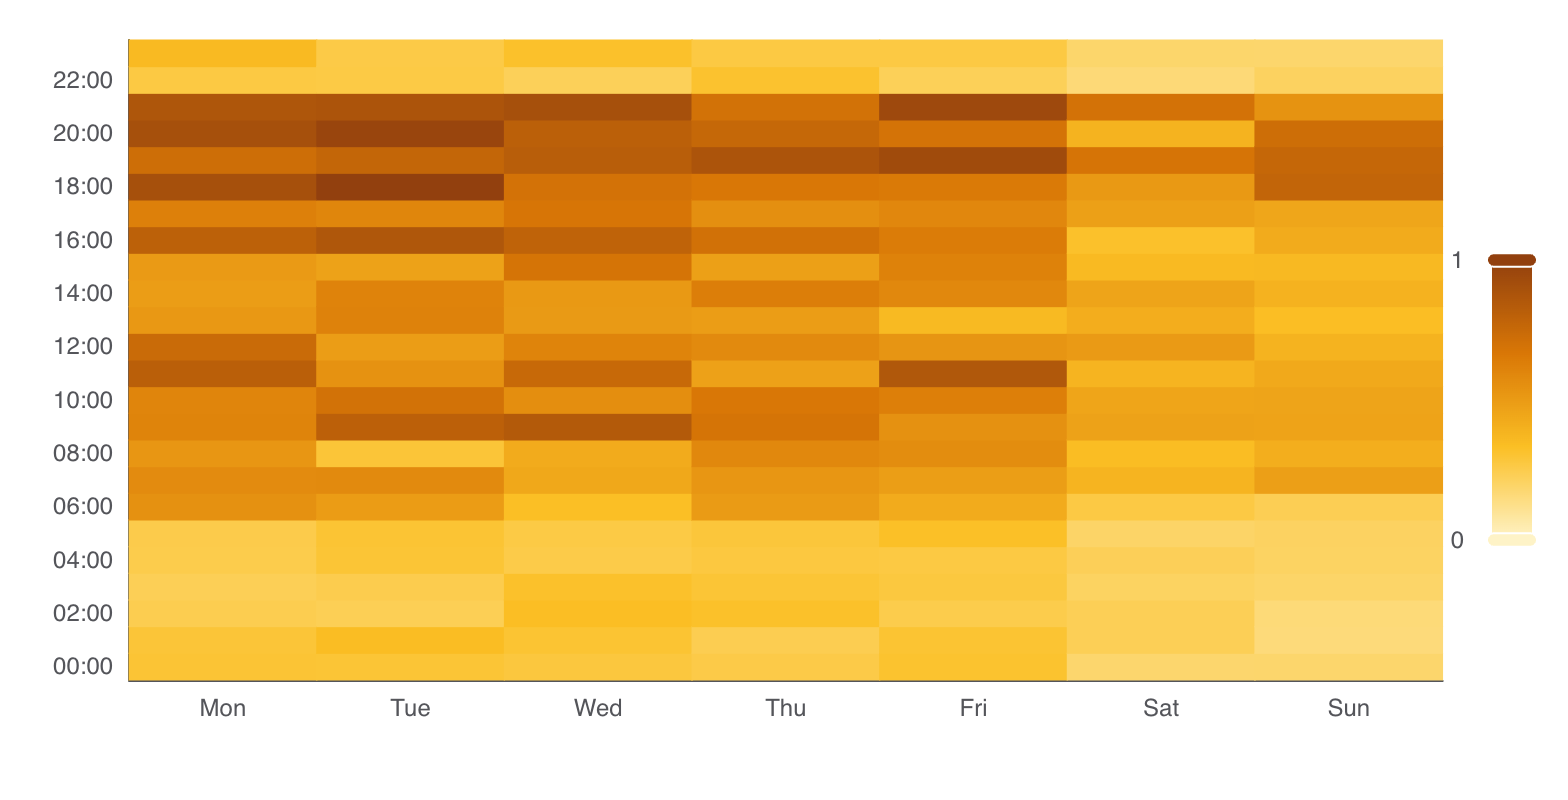
Patterns. A heatmap lays weekday and time of day over each other. Operating hours, night-time consumption and outliers become visible as a colour field long before you would find them in columns of figures. The day profile places a working day and the weekend side by side.
Benchmark. The comparison with the APCS standard load profiles, the Austrian reference load profiles for grid billing, shows whether a connection follows the expected curve or departs from it. Departures are the starting point for the search for savings.
Which patterns keep turning up in quarter-hour values is set out with concrete examples in our post Consumption analysis: 5 patterns in quarter-hour values.
From request to analysis without a detour
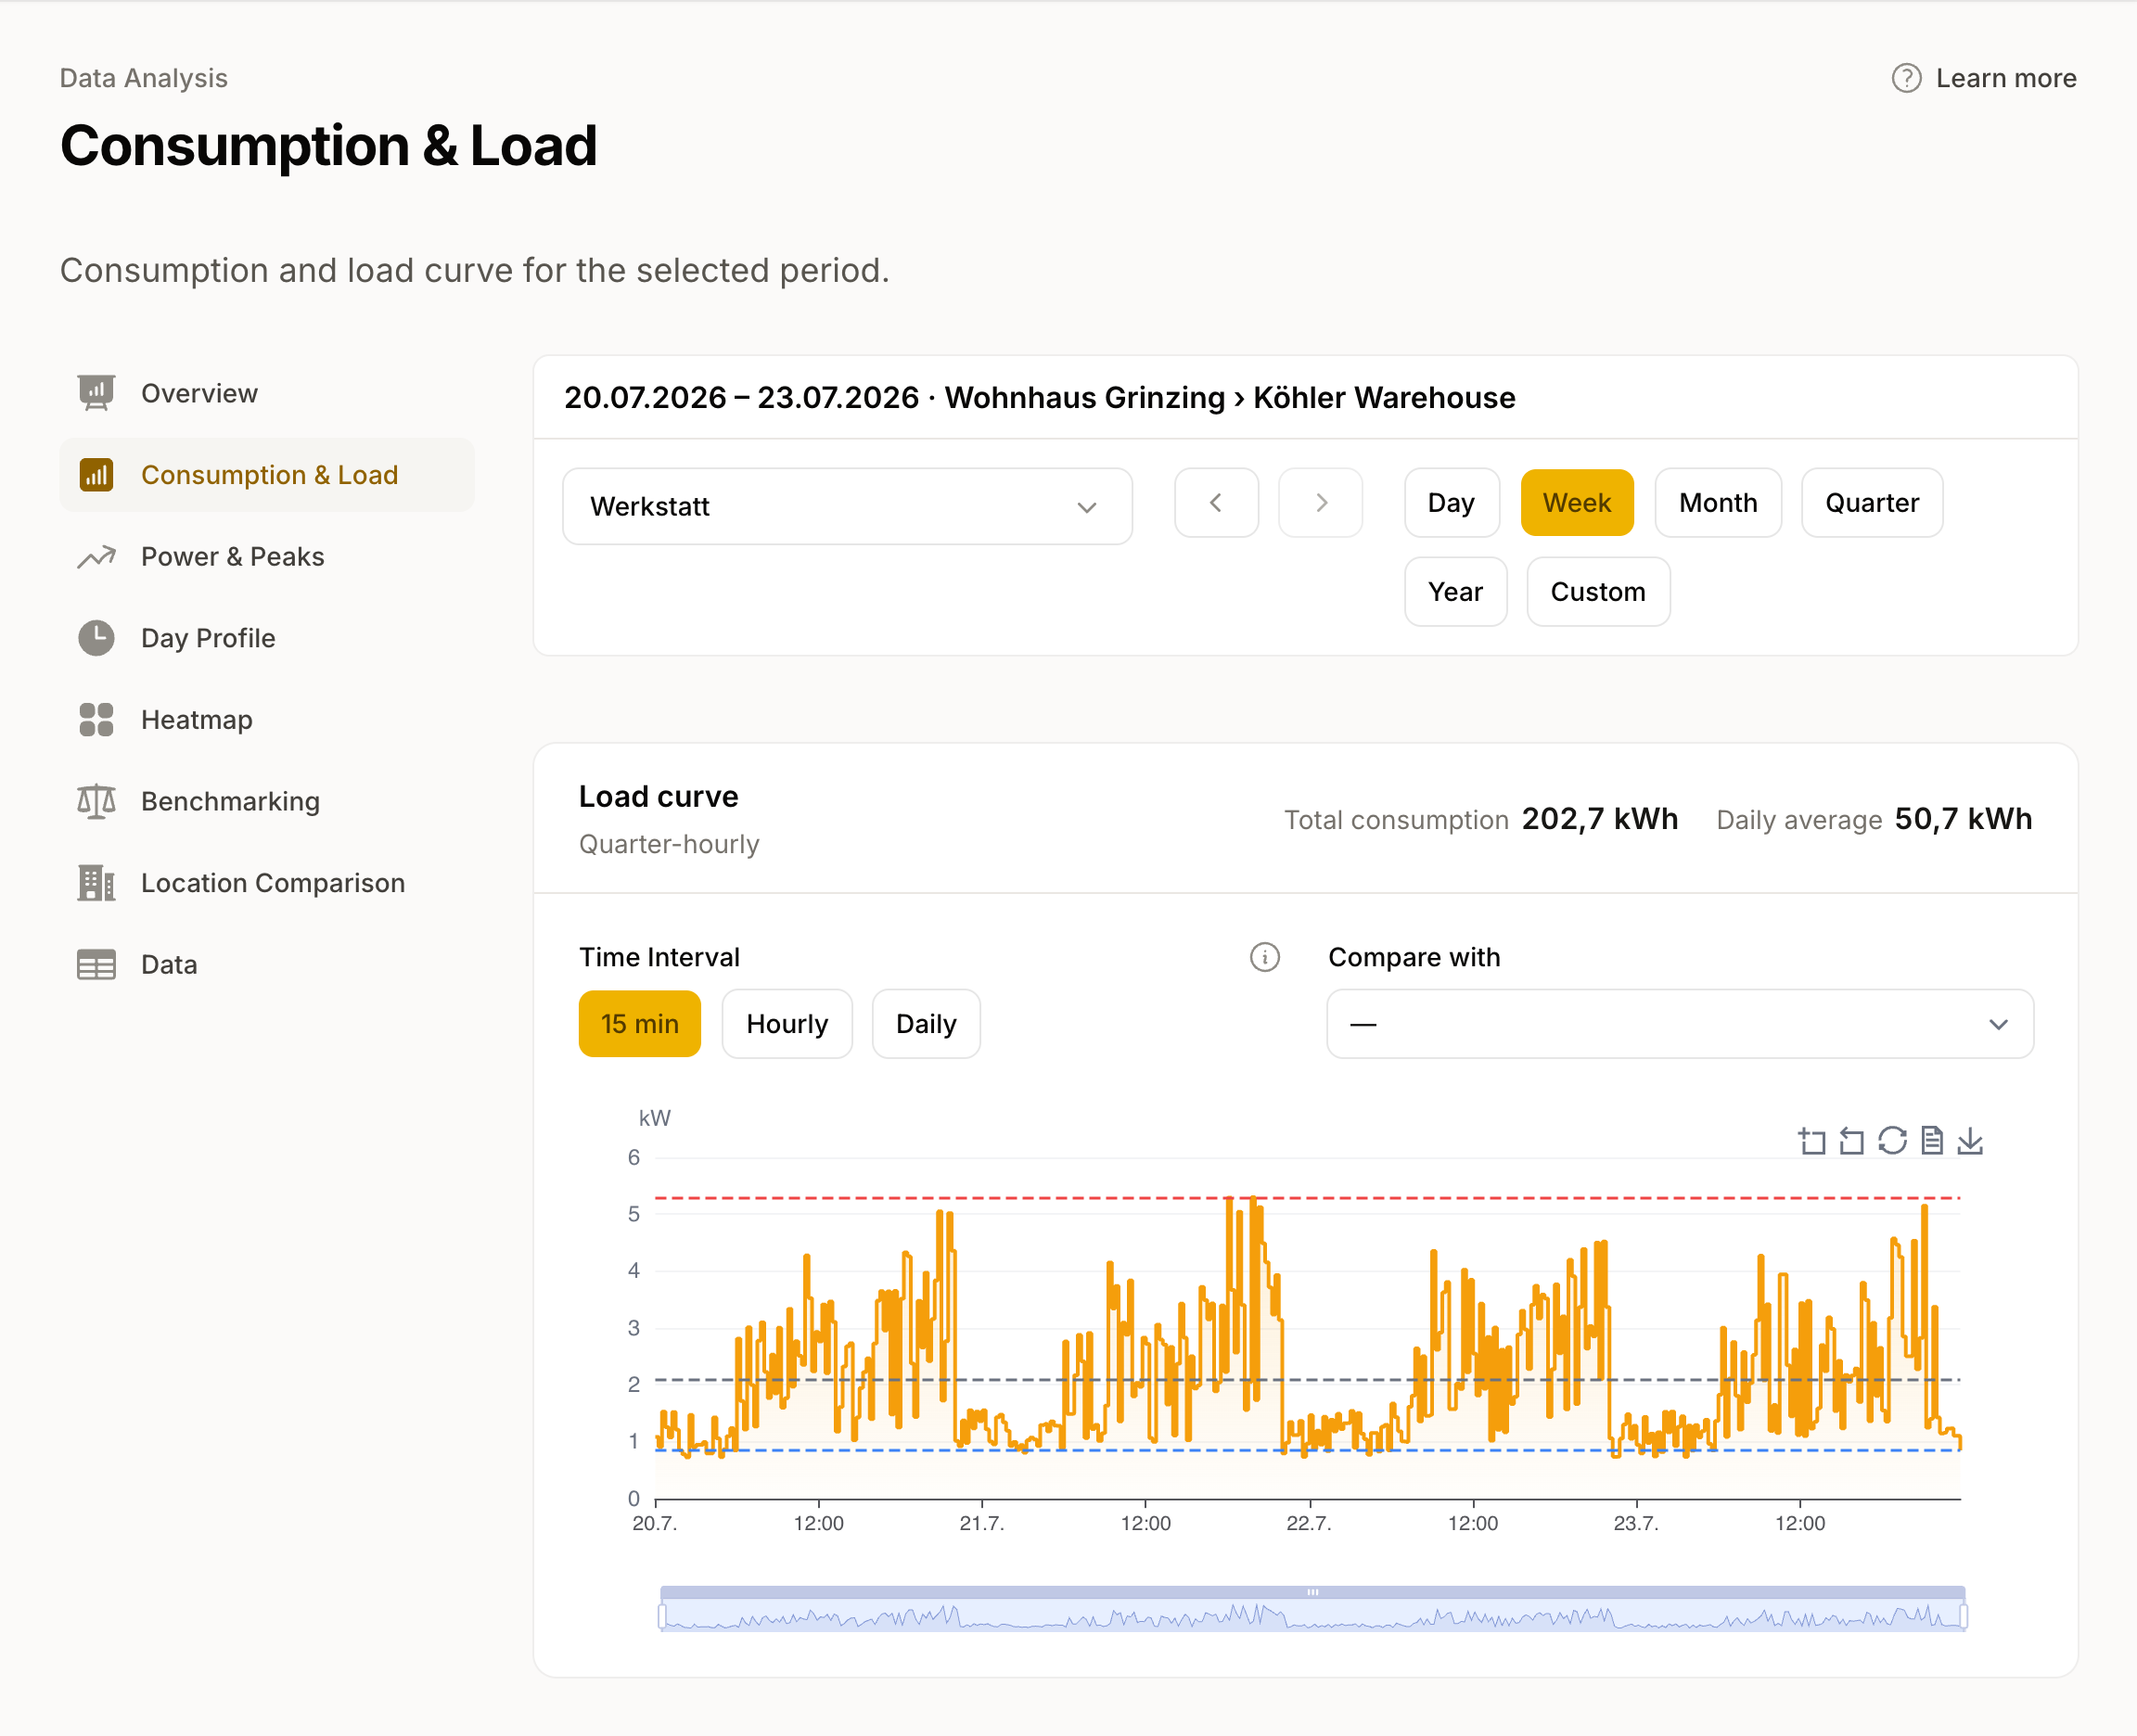
Once a metering point is connected to energiedaten.at, its 15-minute values come in on the platform daily, for both consumption and feed-in. There the load profile is a view, not a file: you switch the resolution between 15 minutes, hourly, daily and monthly, and next to it are the load duration curve with the highest peaks, the heatmap and the benchmark against the APCS standard load profiles. The data from more than 140 grid operators arrives in a single format, which removes the aligning step.
If you do need a file in the end, the CSV export takes the selected period. If the values should go into another system on a regular basis, the API or a webhook handles that. And periods before the connection you request retroactively, as far back as the grid operator holds them, currently up to about three years and depending on the plan; older periods may arrive in daily resolution.
What this analysis looks like day to day is shown on the pages for energy management and energy consulting.
Request and analyse in one place
The load profile is available, and for most commercial connections it is held at full resolution. The work is collecting it from many grid operators and taming the values per meter and year. Hand that part over and more time is left for the analysis itself: where does the base load sit, where the peaks, and what can be reduced?
Request load profiles across all grid operators in one format and analyse them directly. Take a look at the energy analysis, compare the plans or book a demo.
Frequently asked questions
What is a load profile?
A load profile is the time-ordered series of a metering point's consumption values in quarter-hour steps. A smart meter with quarter-hour values produces 96 values a day and around 35,000 a year. Only this resolution makes the base load, load peaks and consumption patterns over the day visible.
How do I request a load profile?
Two routes: you download it from your grid operator's portal as a CSV, metering point by metering point and grid area by grid area. Or you use a service with an EDA connection. Then the metering point owner releases the data once, and the values then arrive daily, across all grid operators, in one format.
At which resolution do I get the load profile?
That depends on the meter. Commercial connections and installations with PV, a heat pump, storage or a charging point carry quarter-hour values. Once the metering point owner releases the data, an authorised third party receives the values at the finest available resolution; a separate opt-in for granularity no longer applies since the ElWG.
How far back can I request load profiles?
Retroactively as far as the grid operator holds the values, currently up to about three years. How far your access reaches also depends on the plan. For older periods the resolution can be coarser and arrive in daily values instead of quarter-hour values.
What software do I need to analyse a load profile?
A single load profile still fits in a spreadsheet. From several metering points on, Excel reaches its limit: around 35,000 values per meter and year, plus a separate export format for each grid area. A platform for energy analysis shows the load duration curve, the heatmap and the benchmark against the APCS standard load profiles as a view, instead of building the values up by hand.
[1] ElWG, BGBl. I Nr. 91/2025, § 54 (3): transition period for daily energy values (until 31 December 2026 at an annual consumption ≤ 5,000 kWh, from 1 January 2027 ≤ 1,500 kWh). Excluded, among others, are metering points with dynamic contracts, generation installations, heat pumps, storage, charging points and participation in shared energy use; these carry quarter-hour values.
[2] ElWG, BGBl. I Nr. 91/2025, § 58: authorised third parties receive the data at the finest available resolution; a separate opt-in for granularity no longer applies. The release by the metering point owner stays the precondition.
Stay up to date
Get new articles and product updates directly in your inbox.
Related articles
Smart meter data via API in Austria
Is there a Smart Meter API from Wiener Netze or EVN? How to read consumption data in Austria through one REST API covering every grid operator.
How energy consultants get hold of their clients' consumption data
Before the analysis comes getting the data, and that is exactly where consultants depend on their clients. How the client consents once and the consumption data then arrives daily.
Would spot pricing have saved you? Your data knows
Does a dynamic electricity tariff actually save money? How the supplier markup, base fee, and your consumption profile decide your savings, and how to calculate it.
Reducing electricity costs: why businesses should make their consumption visible first
Switching tariffs and applying for subsidies help, but without visibility into your own electricity consumption, the foundation is missing. Smart meter data shows where the money actually goes.
Energy data made easy
Smart meter consumption data via API, webhook, or CSV for all Austrian grid operators.
Try for free