Would Spot Pricing Have Saved You? Your Data Knows
Easter Sunday 2026, 2 pm: the day-ahead electricity price falls to −€114/MWh. Three weeks later, on 26 April, the auction price drops to as low as −€480/MWh, a record low.[1] In the first four months of 2026 alone there were 146 hours of negative prices; in April 2025 there were 13.[1]
If you read that, you ask yourself: Would I have saved money on a dynamic electricity tariff?
The answer doesn't depend primarily on the spot price. It depends on your consumption profile.
In brief
- Negative spot prices make headlines but aren't representative. Most hours in the year sit clearly in positive territory. The savings from a spot tariff come from the average across all hours, weighted by your consumption, not from the extremes.
- Your consumption profile decides. Anyone whose load is mostly in the evening between 5 and 10 pm (the typical residential pattern) regularly hits the most expensive spot hours. Anyone who can shift a heat pump, EV charging, or buffer tank in time hits the cheap ones.
- Don't forget the markup and base fee. Austrian spot suppliers with a transparently published split charge a markup per kWh (1.20 to 1.50 ct net) plus a monthly base fee (€1.80 to €4.79 net). At 3,000 kWh annual consumption, that's roughly €66 to €103 net per year on top of the pure exchange price, depending on the supplier.
- Since 1 April 2026 there is a right to a spot tariff. Suppliers with more than 25,000 metering points must offer at least one dynamic product. This is part of the new ElWG package.
- The only reliable answer comes from your own quarter-hourly values. Run your real load profile against historical spot prices and you see what a spot tariff would actually have cost or saved over the past year.
What actually happened at Easter
The combination of holiday and weather produced a textbook example for the electricity market:
- Low load: industry and commerce largely shut down, residential consumption reduced over the long weekend.
- High feed-in: PV record of 53 GW in Germany on the Wednesday after Easter, plus around 44 GW of wind on Easter Sunday morning.[2]
- Full storage and full exports: by 7 am on Easter Sunday, around 11.5 GW were flowing from Germany to Austria, Switzerland, and Poland. Even so, absorption capacity wasn't enough.[2]
Over the Easter weekend (3-6 April) there were more than 30 hours of negative prices. Three weeks later, on 26 April, sunny weather paired with low load produced negative auction prices again. The day's low was −€480/MWh.[1]
This is real and the logical result of an electricity system with a high share of renewables. But it is only a snapshot. Across the full year, most hours sit in positive territory, and winter evenings, when households consume the most, are regularly among the most expensive.
Why the spot price alone tells you nothing about your savings
The average spot price isn't what you pay. You pay the consumption-weighted average. That can deviate from the simple average in either direction.
An example: if the annual average day-ahead price is 9 ct/kWh, but the average price between 5 and 9 pm is 13 ct/kWh, a classic evening consumer on a spot tariff effectively pays closer to 12 ct/kWh than 9 ct/kWh, before the markup is added.
Conversely, anyone charging an EV in late-morning hours pays meaningfully below the average. A heat pump with a buffer tank that shifts its heating cycles into cheap hours benefits too.
The concept is called the load profile: the individual shape of electricity consumption over time. Two households with the same annual consumption of 3,500 kWh can land on results that differ by €100 or more per year on a spot tariff.
When spot pricing pays off, and when it doesn't
Three typical profiles:
Standard household with no load shifting. Consumption concentrated in the morning (7-9 am) and evening (6-10 pm), no heat pump, no EV, no flexible large appliance. These households regularly hit the most expensive spot hours. In most market phases a well-negotiated fixed-price tariff is cheaper here, or at least equivalent, and it comes with no price risk.
Household with heat pump and/or PV. A heat pump with a buffer tank can move its heat-up cycles into cheap hours. With PV feed-in, self-consumption is decoupled from the spot price anyway, and residual draw tends to fall around midday. Spot pricing can pay off here, especially in the summer half of the year.
Household with EV, battery, or controllable large appliance. Anyone who steers charging by spot price (or lets the supplier do it) gets the maximum out of a dynamic tariff. aWATTar and smartENERGY offer apps and APIs for this. This group also benefits directly from negative-price hours.
For all three profiles, what counts is the weighted average across the full year, not spectacular individual days. And the difference to the available fixed price, not the absolute spot price.
Don't forget the markup and base fee
The E-Control tariff calculator in April 2026 lists more than 19 active spot offerings for Austria. The eight suppliers below publish markup and base fee separately (all figures net, excluding 20% VAT; as of April 2026):
| Supplier | Markup on spot | Base fee | Notes |
|---|---|---|---|
| aWATTar HOURLY | +1.50 ct/kWh | €4.79/month | Hourly pricing, quarter-hourly billing since October 2025; base fee per delivery address[3] |
| smartENERGY smartCONTROL | +1.20 ct/kWh | €2.49/month | Hourly pricing; no minimum contract term; two-week notice[4] |
| VKW Strom Dynamisch | +1.20 ct/kWh | €3.00/month | Quarter-hourly pricing; Vorarlberg only[5] |
| VERBUND V-Strom SPOT | +1.40 ct/kWh | €3.99/month | Quarter-hourly pricing; residential customers; 50% discount on the base fee in the first delivery year[6] |
| Spotty SmartBiz / SmartFarm Active | +1.49 ct/kWh | €2.00/month | Quarter-hourly pricing; two separate products (commercial and agricultural) at identical prices; security deposit equal to roughly two months of consumption, recalculated monthly based on EEX forward + 2 ct/kWh risk premium[7] |
| Energie Steiermark SteirerStrom Spot | +1.20 ct/kWh | €3.18/month | Hourly pricing; residential customers up to 100,000 kWh/year[8] |
| AAE Öko Business SPOT Stunde II | +1.30 ct/kWh | €3.00/month | Quarter-hourly pricing; commercial customers up to 100,000 kWh/year; cancellable at any time; negative spot prices floored at zero[9] |
| oekostrom AG oeko Spot+ | +1.50 ct/kWh | €1.80/month | Quarter-hourly pricing; certified green electricity (Austrian eco-label UZ 46); cancellable at any time[10] |
At 3,000 kWh annual consumption, markup plus base fee work out to roughly €66 (smartENERGY, oekostrom AG) to €103 (aWATTar) net per year, depending on the supplier, on top of the pure exchange price. For small households below 1,500 kWh, the base fee alone can more than wipe out the benefit of low spot prices.
That doesn't make spot tariffs unattractive. But the comparison has to be complete: average spot price + markup + base fee against fixed price + base fee, on the same basis (net or gross).
The SNAP effect in summer
Alongside the ElWG package, the Sommer-Nieder-Arbeitspreis (SNAP) is in force as of 1 April 2026: a reduced network charge for consumption between 10 am and 4 pm in the months April through September.[11] Prerequisite: smart meter, grid level 7, opt-in.
SNAP works independently of the energy price. But it makes exactly those midday hours, when spot is often cheap, doubly attractive. Combining a spot tariff and SNAP doubles the incentive to shift consumption into the sunny midday hours: heat pump, water heater, dryer, EV charging.
For the "fixed price vs spot" comparison, SNAP is a relevant secondary factor, especially for households with load-shifting potential in the summer half-year.
A concrete example: 4 months, 10 ct/kWh fixed-price tariff
Take an example household. Four months (January through April 2026), fixed price 10.0 ct/kWh, base fee €4.50/month. Total consumption: 2,624.6 kWh.
| Month | Grid draw | Avg spot price | Spot cost | Fixed cost | Difference |
|---|---|---|---|---|---|
| January | 1,207.2 kWh | 11.72 ct/kWh | €161.37 | €125.22 | +€36.15 |
| February | 664.5 kWh | 9.62 ct/kWh | €75.68 | €70.95 | +€4.73 |
| March | 367.9 kWh | 5.93 ct/kWh | €29.12 | €41.29 | −€12.17 |
| April | 385.0 kWh | 3.97 ct/kWh | €22.86 | €43.00 | −€20.14 |
| Total | 2,624.6 kWh | 10.7 ct/kWh | €289.03 | €280.46 | +€8.57 |
Spot cost and fixed cost each include the monthly base fee.
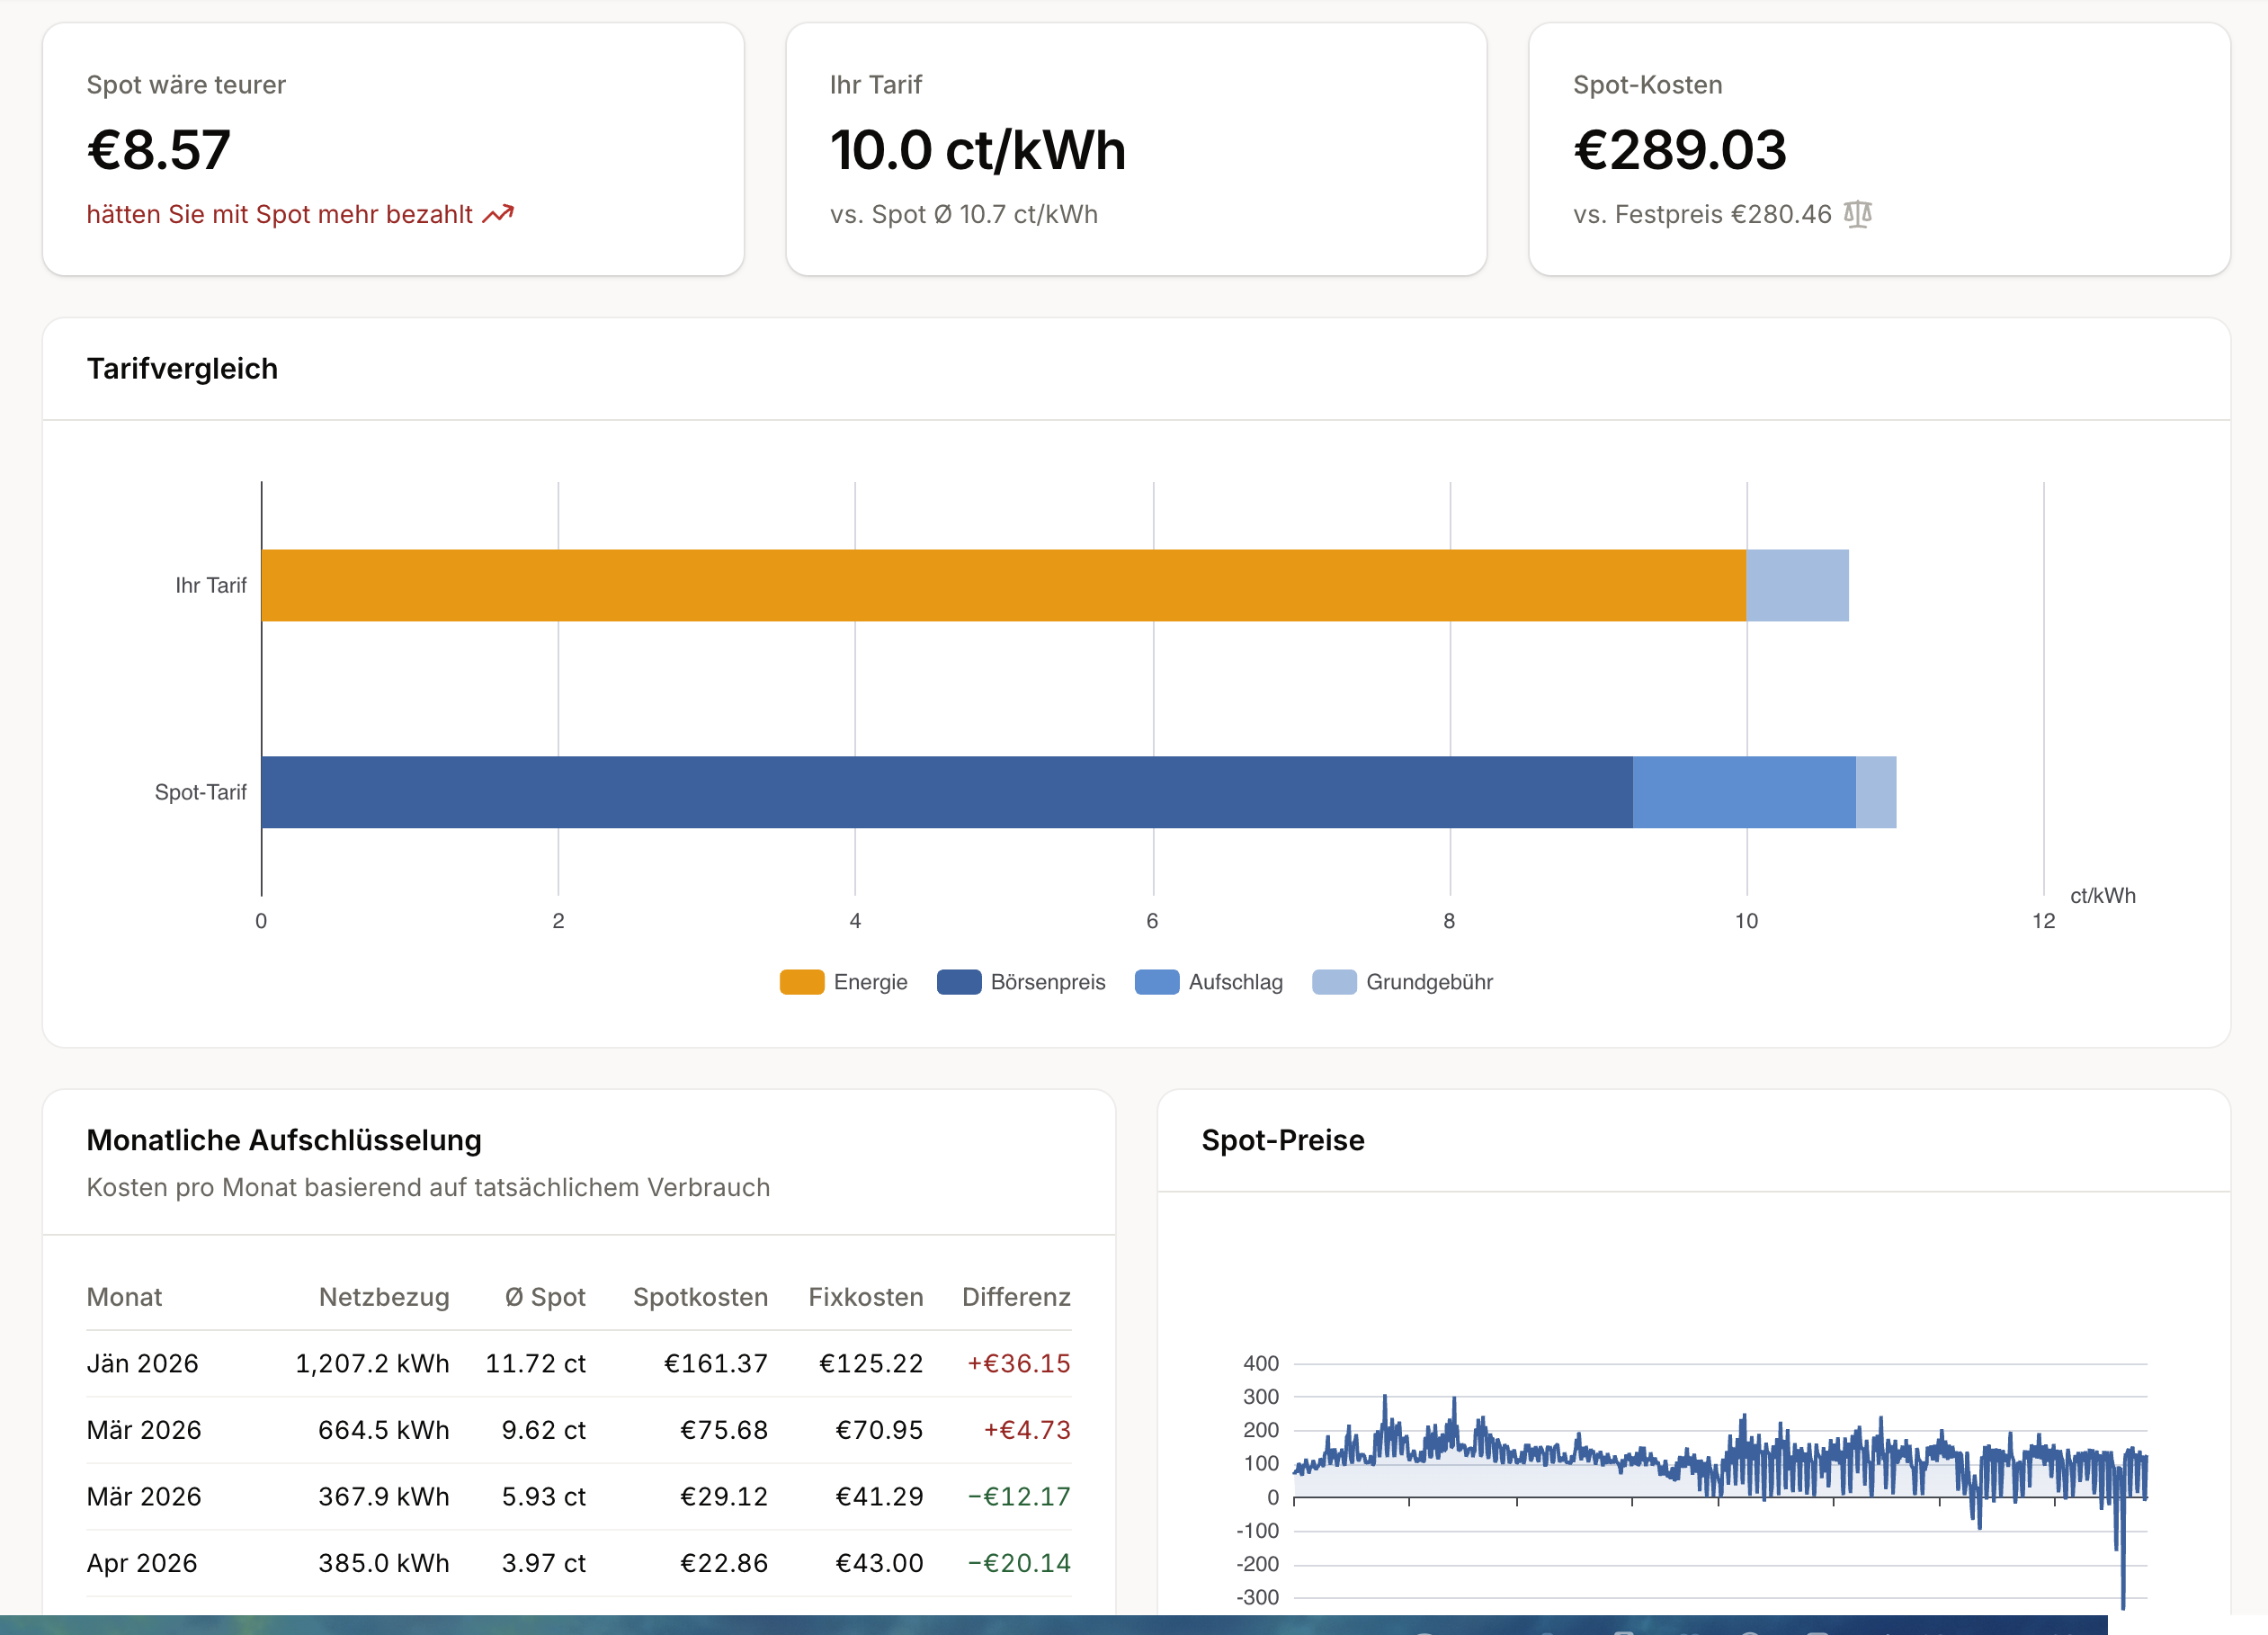
Despite the negative-price spikes in April, the spot tariff would have cost this household €8.57 more on net, split into an expensive winter and a cheap spring. January alone produced +€36.15 because high consumption (1,207.2 kWh) hit high winter prices. April delivered €20.14 in savings because low consumption met historically low spring prices.
That's what a standard household looks like: spot is often cheaper in summer, often more expensive in winter, and the year-end balance depends on the weighting. Without load-shifting potential, the difference usually stays small, in either direction.
How to calculate your actual savings
The comparison isn't mathematically complicated, but it needs two datasets:
- Your load profile in quarter-hourly values over at least six months, ideally twelve. This data sits with your grid operator and is retrievable through their customer portal as CSV or XLSX.
- The day-ahead spot prices for the same period, at the same granularity.
Multiply each quarter-hourly value by its corresponding spot price, add markup and base fee, and compare the result with what you actually paid for energy. That's your reliable answer. No average-price comparison, no gut feel.
For an overview of currently available tariffs, the regulator runs the E-Control commercial tariff calculator. You can use a default load profile or upload your own from your grid operator's smart meter portal. The platform then runs your consumption against the actively listed tariffs, spot offerings included. It's built as a one-shot comparison: one metering point per query, manual upload, a snapshot at the moment you click. What it doesn't cover: several metering points in parallel, automated data retrieval direct from the grid operator, or the whole thing as a recurring analysis that updates itself every month.
We've built a tool for energiedaten.at that does exactly this calculation: the Spot Analysis. You enter your current tariff (energy price ct/kWh + base fee), the system pulls your quarter-hourly values and the spot prices, and shows you month by month what you would have paid. Works for a single metering point or an entire portfolio of smart meters, repeatable any time with refreshed data.
Frequently asked questions
What is a spot tariff?
A spot tariff (also called a dynamic electricity tariff) is a supply contract whose energy price tracks the hourly or quarter-hourly day-ahead prices on the wholesale electricity market. The supplier adds a markup per kWh and a monthly base fee on top of the exchange price. A smart meter with quarter-hourly readings is required.
Do I need a smart meter for a spot tariff?
Yes. Without quarter-hourly readings, the supplier can't bill on hourly or quarter-hourly spot prices. If your metering point doesn't have a smart meter yet, your grid operator handles the rollout. After installation you typically have to opt in to quarter-hourly value storage in the grid operator's customer portal. Otherwise only daily totals are kept.
Does a spot tariff always save money?
No. The savings depend on when electricity is consumed. Households whose consumption is concentrated in the evening hours between 5 and 10 pm regularly hit the most expensive spot hours. Negative or very low midday prices (as seen at Easter and on 26 April 2026) only help if part of the load falls into those hours: heat pump with buffer tank, daytime EV charging, scheduled large appliances.
Do I get money back when spot prices go negative?
It depends on the contract. Some suppliers pass negative spot prices through in full, so the pure energy price in those hours is genuinely negative. Others floor billing at zero; AAE Öko Business SPOT Stunde II does so explicitly per its price sheet (see the table above). Read the price sheet before signing, and remember that markup and base fee continue to apply in either case.
What happens during extreme price spikes?
Spot tariffs have no contractual price cap. During the 2022 energy crisis, day-ahead prices traded several times above the long-term average for stretches; households without load-shifting capability would have paid those prices in full. Practical consequence: keep a liquidity buffer for a bad month, shift large loads into cheap hours where possible, and switch back to a fixed tariff if the market outlook deteriorates. Several Austrian spot suppliers offer no minimum contract term and short notice periods.
[1] ZfK – Zeitung für kommunale Wirtschaft, "Negative Preise: 2026 auf dem Weg zum Rekordjahr" (as of 28 April 2026): 146 negative hours Jan-Apr 2026 (+30% vs the same period last year); auction record of −€480/MWh on 26 April 2026. Figures cover the German-Luxembourg bidding zone (DE-LU); the Austrian day-ahead zone is price-coupled and moved within the same range over those days.
[2] Cleanthinking, "Strom im Überfluss: Was an Ostern 2026 im Stromnetz passiert": PV peak 53 GW and wind output 44 GW (Germany); daily low −€114/MWh on Easter Sunday 2 pm; more than 30 hours of negative prices over the Easter weekend.
[3] aWATTar Austria, "HOURLY tariff" (awattar.at/tariffs/hourly): EPEX Spot AT plus 1.500 ct/kWh net markup; base fee €4.79/month net (€5.75 gross). Base fee charged once per delivery address. Quarter-hourly billing since October 2025.
[4] smartENERGY smartCONTROL (smartenergy.at/smartcontrol): EPEX Spot AT hourly plus 1.44 ct/kWh incl. 20% VAT (1.20 ct/kWh net); base fee €2.99/month incl. VAT (€2.49 net). No minimum contract term.
[5] VKW Strom Dynamisch (vkw.at/produkte/strom/strom-dynamisch): EPEX Spot Day-Ahead AT quarter-hourly plus 1.44 ct/kWh gross (1.20 ct net); base fee €43.20/year gross (€36.00/year net = €3.00/month net). Vorarlberg only.
[6] VERBUND V-Strom SPOT (verbund.com/de/privat/strom/v-strom-spot, product information sheet as of December 2025): EPEX Spot Day-Ahead AT quarter-hourly plus 1.40 ct/kWh net fixed-price component; base fee €4.79/month incl. VAT (€3.99 net). 50% discount on the base fee in the first delivery year.
[7] Spotty SmartBiz Active / SmartFarm Active (spottyenergie.at/agb, price sheet effective 01.10.2025): EPEX Spot AT quarter-hourly plus 1.49 ct/kWh net (1.79 ct/kWh gross); base fee €2.00/month net (€2.40 gross) per metering point. Security deposit equal to two months of consumption, recalculated monthly based on the EEX forward average of the next four quarterly futures plus a 2 ct/kWh net risk premium. SmartBiz (commercial customers) and SmartFarm (agricultural customers) are two separate products at identical prices.
[8] Energie Steiermark SteirerStrom Spot (e-steiermark.com/privat/produkte/strom/spottarif, tariff sheet effective 01.08.2024): EPEX Spot AT hourly plus 1.44 ct/kWh gross (1.20 ct/kWh net, listed there as "Abwicklungsgebühr"); base fee €3.82/month gross (€3.18 net). Residential customers with electricity consumption up to 100,000 kWh/year.
[9] AAE Naturstrom Vertrieb, Öko Business SPOT Stunde II (aae.at/blog/stromtarif/oeko-business-spot-stunde-2, price sheet effective 07.10.2025): EPEX Spot AT quarter-hourly plus 1.30 ct/kWh net fixed-price component; base fee €3.00/month net (€3.60 gross) per metering point. Commercial customers up to 100,000 kWh annual consumption, cancellable at any time, no contract lock-in. Negative spot prices floored at zero in billing.
[10] oekostrom AG oeko Spot+ (oekostrom.at/spot-preis): EPEX Spot AT quarter-hourly plus 1.80 ct/kWh gross (1.50 ct/kWh net, listed there as "Abwicklungsgebühr"); base fee €2.16/month gross (€1.80 net). Green electricity certified under the Austrian eco-label UZ 46 ("Grüner Strom"). Cancellable at any time.
[11] System Usage Charges Regulation 2018, BGBl. II No. 398/2017, § 2 para. 9 and § 5 para. 1b: Sommer-Nieder-Arbeitspreis. Applies at grid level 7, electronically metered, summer half-year 10:00-16:00.
Stay up to date
Get new articles and product updates directly in your inbox.
Related articles
How Energy Consultants Get Hold of Their Clients' Consumption Data
Before the analysis comes getting the data, and that is exactly where consultants depend on their clients. How the client consents once and the consumption data then arrives daily.
Reducing electricity costs: why businesses should make their consumption visible first
Switching tariffs and applying for subsidies help, but without visibility into your own electricity consumption, the foundation is missing. Smart meter data shows where the money actually goes.
Common area electricity under control: how property managers use smart meter data
Property managers receive common area electricity as an annual lump sum: one number, no detail. Smart meter data makes anomalies, trends, and savings visible.
Consumption analysis: 5 patterns in quarter-hourly data
Five patterns in quarter-hourly smart meter data that matter for EEffG compliance, ISO 50001, and efficiency analysis at the enterprise level.
Energy data made easy
Smart meter consumption data via API, webhook, or CSV, for all Austrian grid operators.
Try for free