Using smart meter data: 5 practical examples
Over 6.5 million electricity connections in Austria now have a smart meter. Since the ElWG update in December 2025, Austria's electricity market law requires quarter-hourly data transmission by default: 96 readings per day per meter. The data is there. But what can you actually do with it?
Five practical examples show what's possible with smart meter data, from spotting consumption patterns to integrating with a smart home system. All examples work with the free Community plan on energiedaten.at.
1. Spot consumption patterns: When do you use the most electricity?
The first look at your own smart meter data is often the most surprising. The heatmap displays electricity consumption as color-coded tiles: hours on the Y-axis, days on the X-axis. The darker the color, the higher the consumption in that time window.
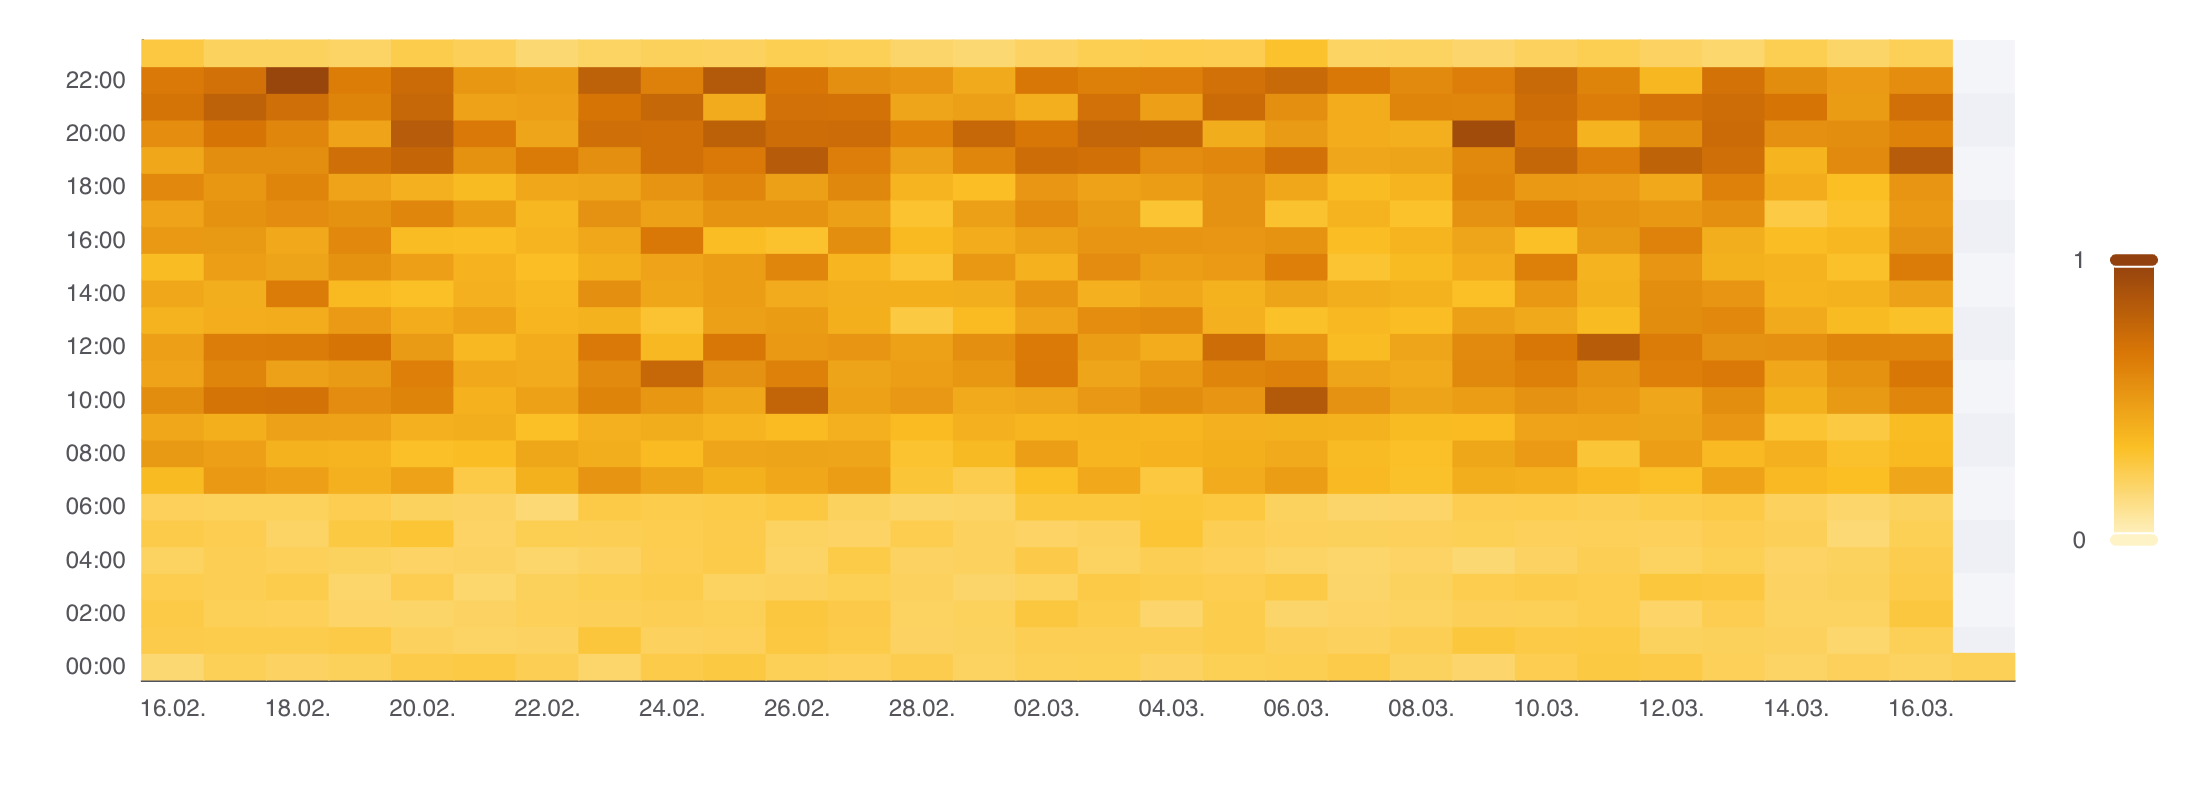
What appears as a single number on your annual bill suddenly becomes visible: the morning coffee at 6:30, cooking at 6 PM, higher usage on weekends. Patterns you may have suspected but never actually seen.
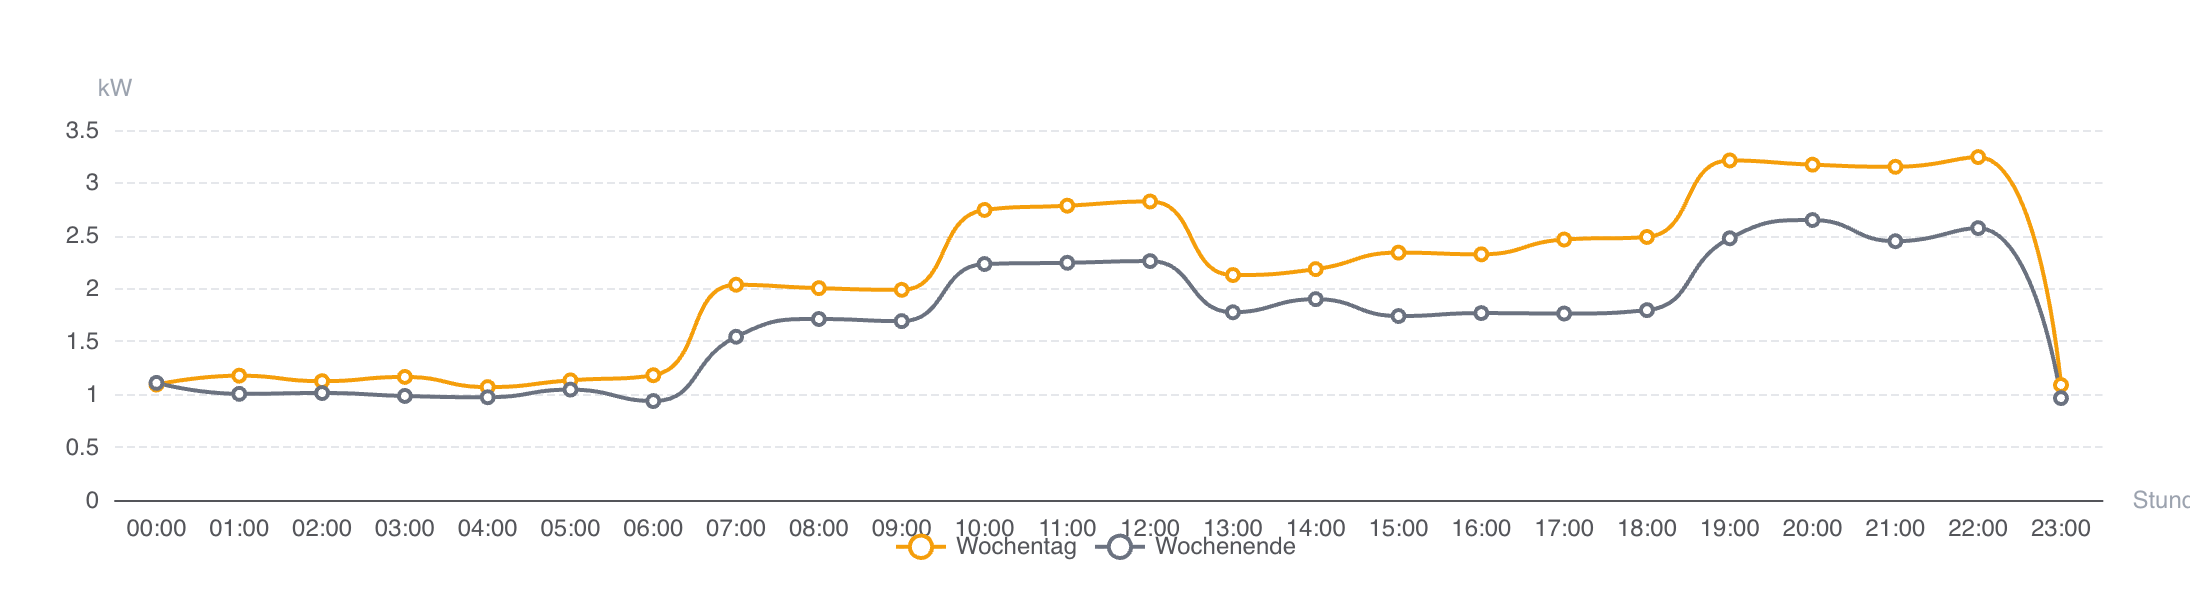
The day profile comparison adds another layer: two overlaid curves showing average consumption on weekdays versus weekends. The differences are noticeable in most households, such as a later morning ramp-up on weekends or higher daytime usage from working at home.
2. Find your base load: What's running when nobody's home?
Base load is the electricity consumption that never stops; at night, on holidays, even when you're away. On the heatmap, it shows as the uniform color band during nighttime hours: the constant minimum that never reaches zero.
energiedaten.at displays the base load as a dedicated metric in kWh, no manual calculation needed. Behind it are devices running around the clock: the fridge, the router, standby power from entertainment electronics, chargers left plugged in.
How much does that add up to? In a typical household, standby consumption accounts for roughly 300 to 400 kWh per year, about 5 to 10% of total electricity consumption.
The benchmark comparison line helps put this in context: if your nighttime baseline sits noticeably above the reference value for a similar household, it's worth checking which devices draw standby power. Switchable power strips are an option: TVs, game consoles, and audio systems often consume more in standby than expected.
3. Compare with the average: Am I above or below?
Everyone wants to know whether their consumption is "normal." After entering your building type and number of occupants, energiedaten.at shows a benchmark comparison: your actual consumption alongside the statistical average for a comparable household.
The display is color-coded: green for below-average consumption, red for above-average, gray for around the mean. A dashed reference line on the consumption chart shows the expected pattern over time.
Example: the average for a two-person apartment is around 2,200 kWh per year; for a two-person detached house, 3,100 kWh. These values are based on Austrian consumption statistics.
Important: these are statistical averages, not a substitute for a professional energy audit. But they provide a starting point for understanding where your consumption stands.
4. Track trends over weeks and months
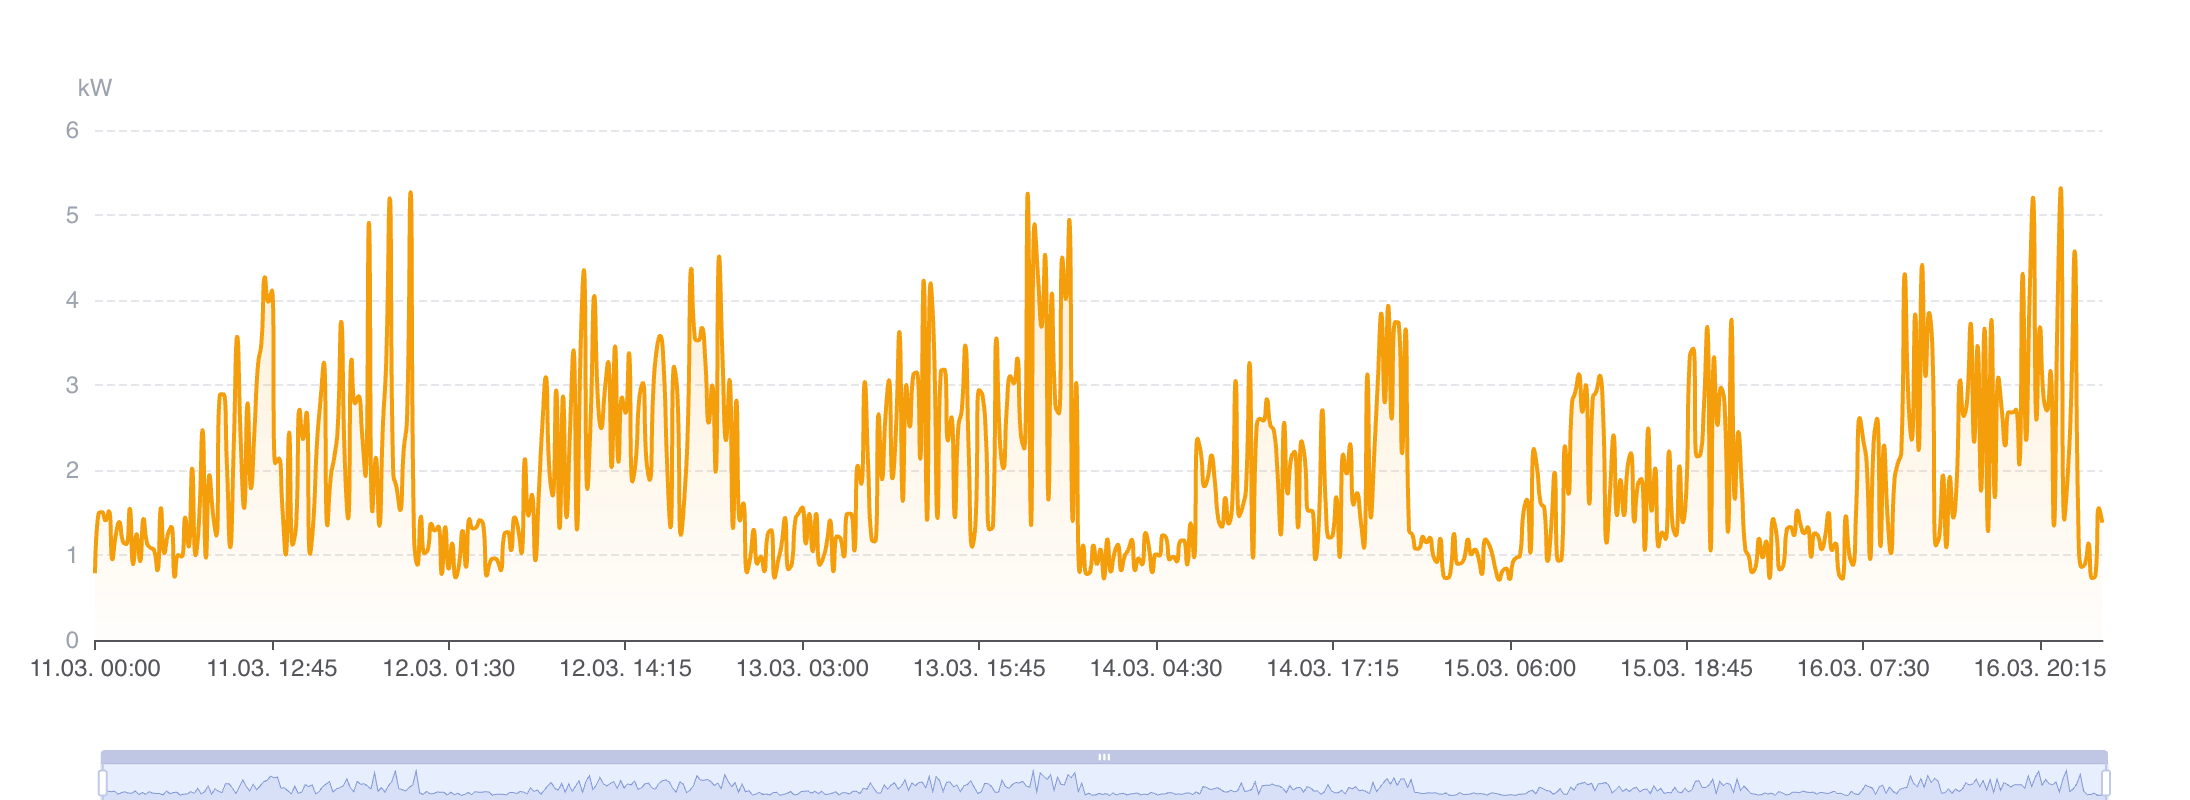
Individual days reveal patterns. But only over weeks and months do trends emerge: seasonal shifts (higher in winter, lower in summer), the effect of a new appliance, or behavioral changes like switching to working from home.
The load profile chart with date range selection and zoom makes these changes tangible: When did consumption shift? Is the new fridge really more efficient? What difference did switching to LED lighting make?
3 months of data retention on the Community plan is enough to spot seasonal trends and measure the impact of specific changes.
5. Integrate with Home Assistant
For the technically inclined: the Community plan includes API access. This makes it possible to pull smart meter data into Home Assistant, the open-source home automation platform.
We provide a dedicated HACS integration that handles the entire setup through the Home Assistant UI, with no YAML configuration required.
- Install the integration via HACS (add as custom repository)
- Go to Settings → Add Integration and search for "energiedaten.at"
- Enter your API key (the team is derived from the key)
- Select which meters to import; consumption and feed-in sensors are created for each
The integration imports quarter-hourly kWh values with correct historical timestamps directly into Home Assistant's long-term statistics database. Your data appears in the Energy Dashboard attributed to the actual time of consumption, not the moment of import.
Since energiedaten.at delivers data once daily (T-1), the integration polls every 6 hours to pick up new batches. How data travels from the meter to your system is covered in a separate article.
Everything included in the free Community plan
Heatmap, day profiles, base load metric, benchmark comparison, load profile chart, and API access: all five examples work with the Community plan, a single meter, and no payment details required.
If you need CSV/XLSX export, webhooks, multiple meters, or longer data retention, those are available on paid plans. For getting started, the Community plan covers everything.
For property managers looking to track common area electricity across a building portfolio, a dedicated article explains how smart meter data makes operating cost settlements more transparent.
Stay up to date
Get new articles and product updates directly in your inbox.
Related articles
How Energy Consultants Get Hold of Their Clients' Consumption Data
Before the analysis comes getting the data, and that is exactly where consultants depend on their clients. How the client consents once and the consumption data then arrives daily.
Would Spot Pricing Have Saved You? Your Data Knows
Does a dynamic electricity tariff actually save money? How the supplier markup, base fee, and your consumption profile decide your savings, and how to calculate it.
Reducing electricity costs: why businesses should make their consumption visible first
Switching tariffs and applying for subsidies help, but without visibility into your own electricity consumption, the foundation is missing. Smart meter data shows where the money actually goes.
Common area electricity under control: how property managers use smart meter data
Property managers receive common area electricity as an annual lump sum: one number, no detail. Smart meter data makes anomalies, trends, and savings visible.
Energy data made easy
Smart meter consumption data via API, webhook, or CSV, for all Austrian grid operators.
Try for free