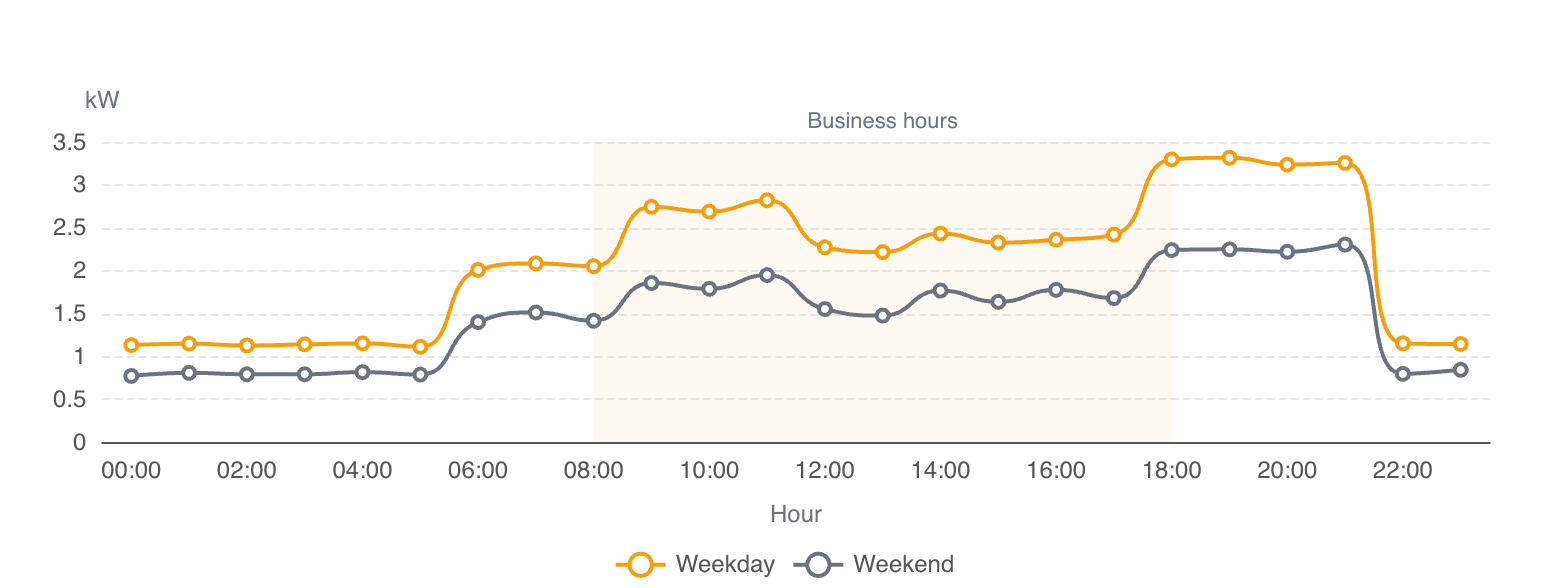
Energy consulting lives on analysis. Reading load curves, tracking down standby consumption, turning it into savings potential backed by hard numbers: that is the work your clients pay for. But before it comes an unremarkable step that, on many engagements, costs more time than the analysis itself. The client's consumption data has to be on the table first.
The bottleneck is getting the data
Look at your own process. It starts with the conversation, then scoping the need, then the analysis, and finally the report. In between sits the step no one likes to talk about: the client provides the data. In practice, what arrives is an Excel file with gaps, a follow-up question follows, and by the time the values are complete, a week has passed.
With one engagement that is bearable. With ten it becomes a pattern. Every new client brings the same loop with them before the actual consulting even begins.
As a consultant, you are not at the source
The reason is structural. The meter sits at the client's premises, and the data is theirs. You cannot pull the consumption yourself. You depend on your client handing it to you, and that is exactly where the chain breaks: the client has other things to do, the export stays incomplete, the format changes from case to case. The usual ways to read out smart meter data also lead back through your client: the grid operator portal requires their personal login, the interface on the meter requires on-site access. As a consultant, you do not retrieve the data yourself.
Smart meters do not change that, at first. The meters for it have long been installed: around 97 percent of Austrian electricity connections have a smart meter that measures in 15-minute intervals.[1] You gain access to these values as soon as your client releases them for sharing. Since the ElWG, you then receive them at full resolution: the finest granularity has become the standard for authorised third parties, and the earlier extra step is gone.[2] So the data is there. What is missing is a path that does not run through your client's inbox.
One release per client, then the data flows
The path runs through a one-time release per client. Your client consents to sharing the data once, in their grid operator's portal, for their metering point. From that moment, the 15-minute values arrive daily. Every new client gives their own release, but only once: the Excel loop from earlier does not repeat.
We do not take the consent itself off your client's hands. The step in the grid operator portal they do themselves; that is the legally prescribed path through their grid operator, the same body that operates their meter. For them it is a few clicks. Your client stays involved, but their part ends with the release: after that you do not have to ask again.
How the release works
- You enter the client's metering point number, the 33-character number from their electricity bill.
- energiedaten.at sends the data request to the grid operator.
- Your client, the meter holder, gives the release in their grid operator's portal.
- The data arrives daily, here is what the path looks like in detail.
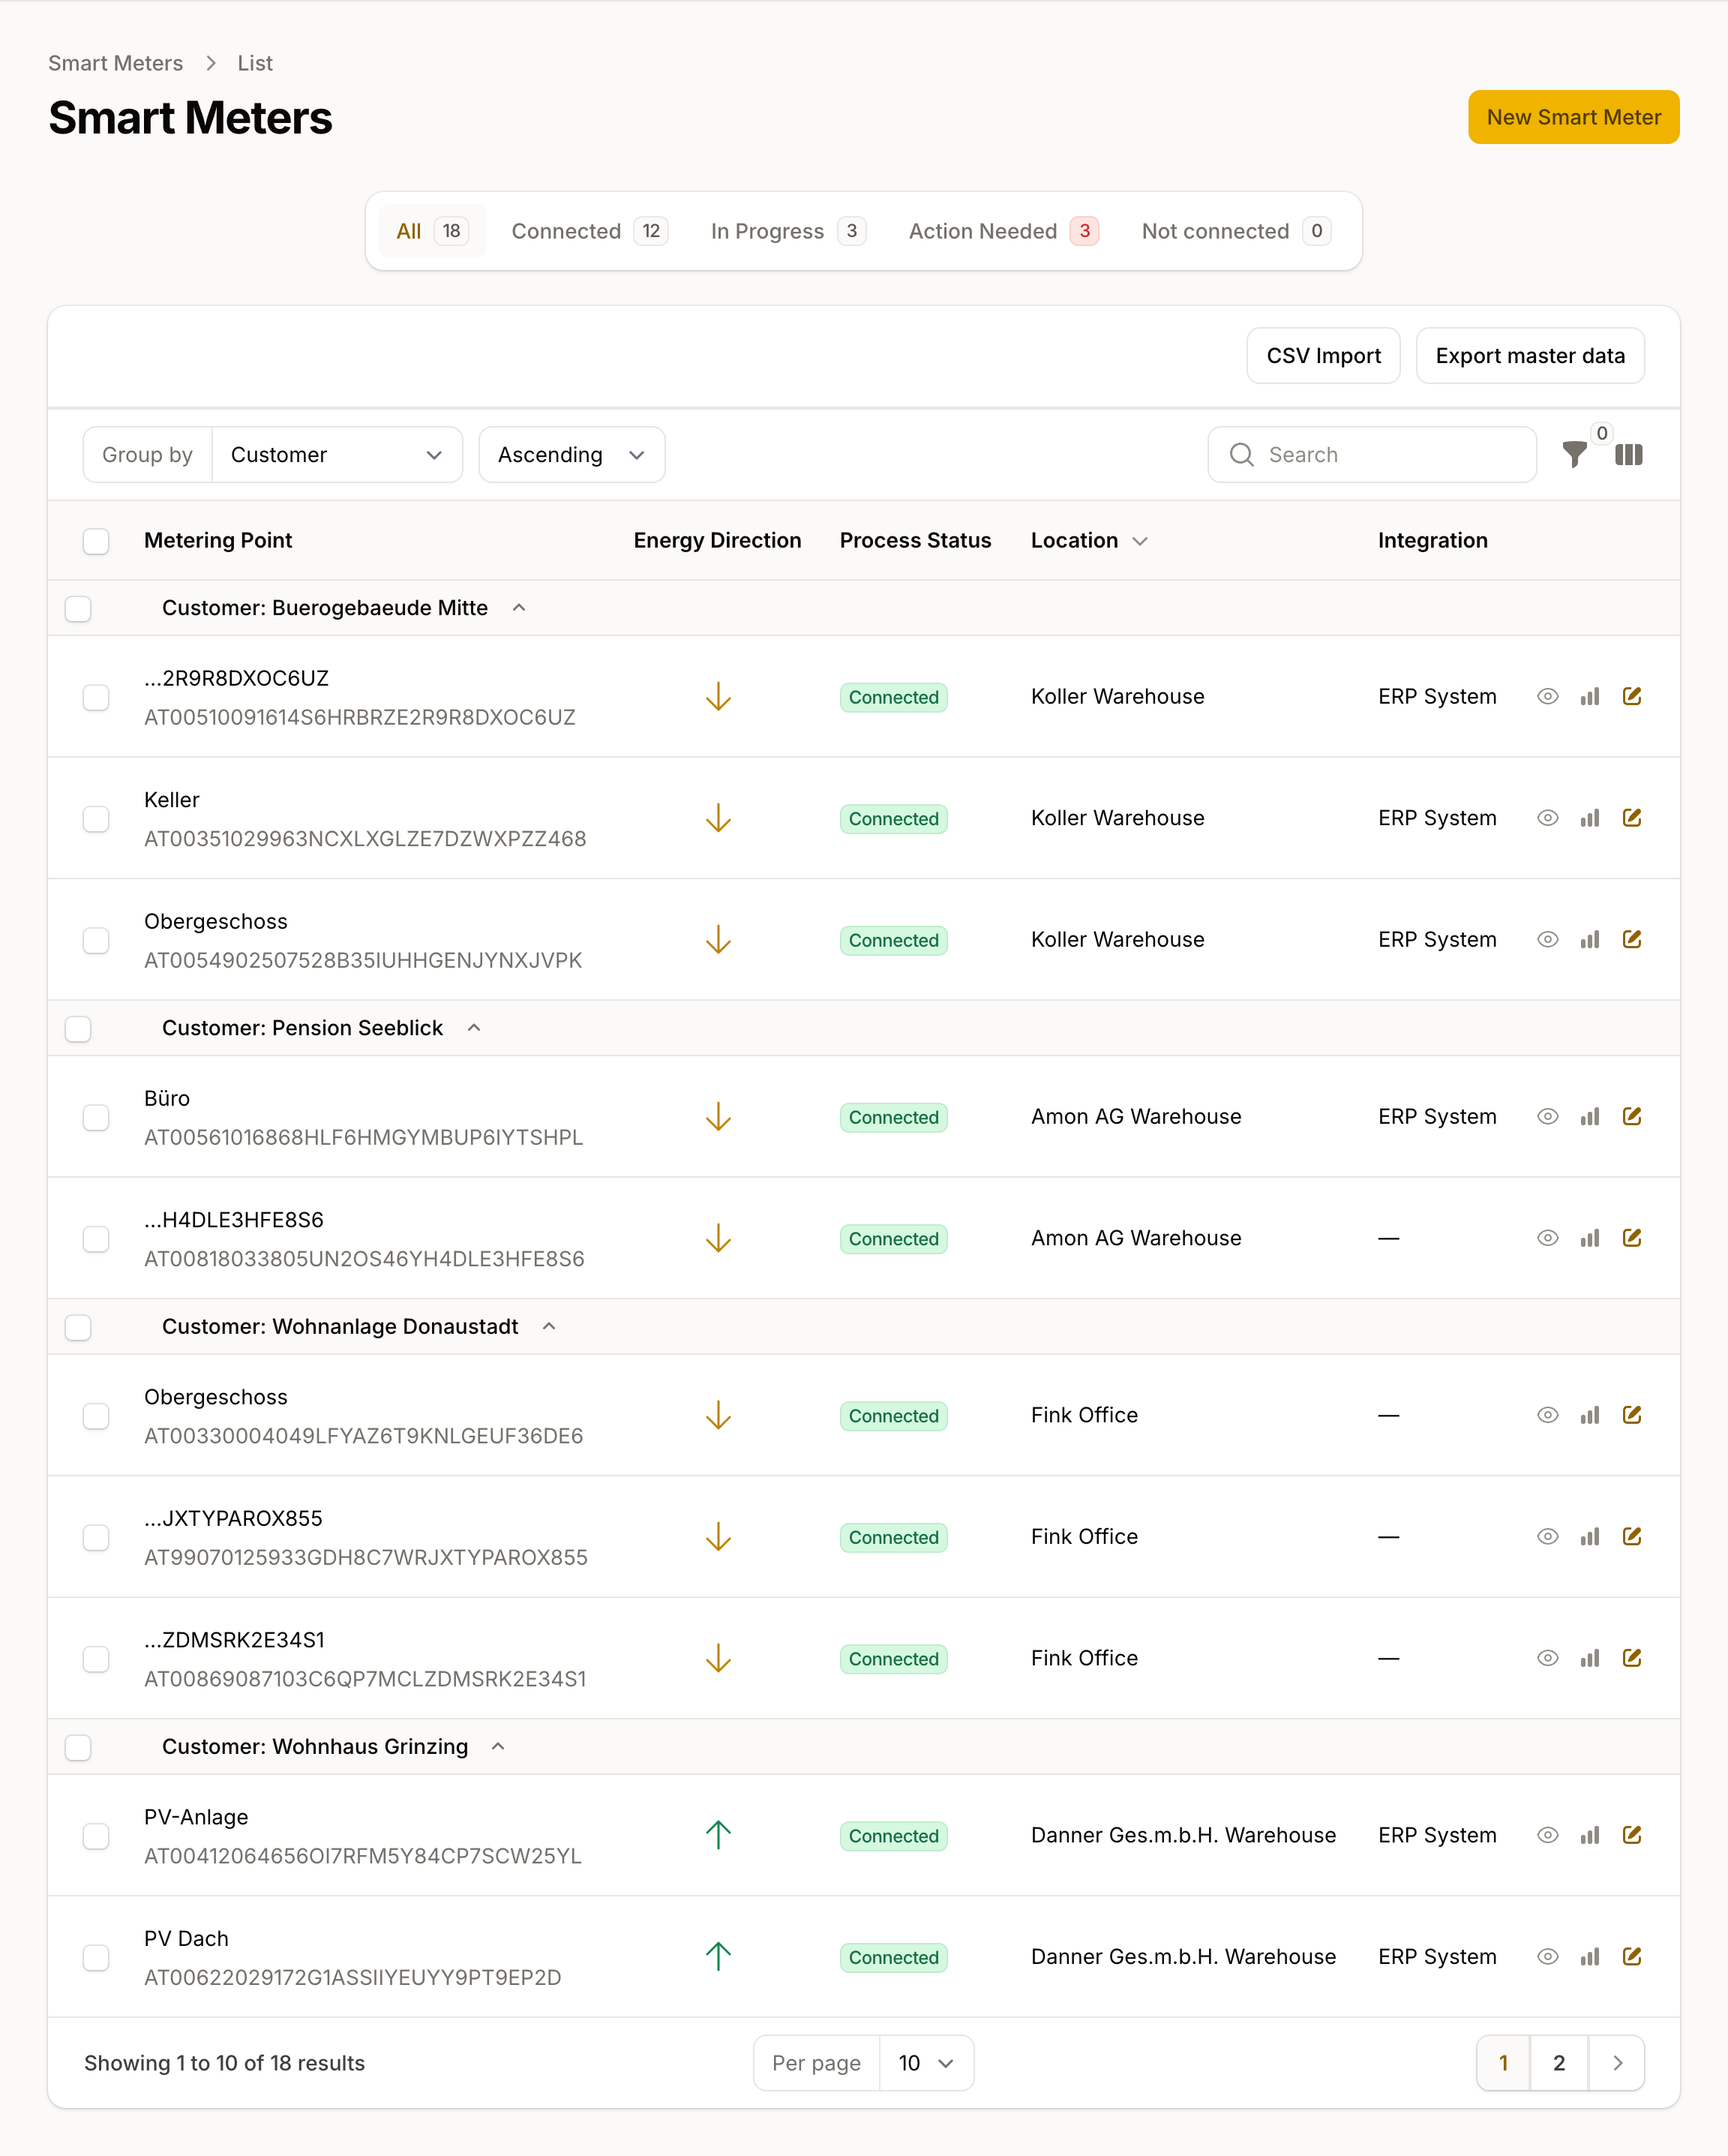
One release per metering point. If a client has several locations, it is one release per location. You see the status of each request, whether pending, active, or expired, in one place, instead of keeping it in your head per client.
What arrives at your end
For the analysis, the format matters. Consultants want the values where they work with them, which means CSV. energiedaten.at delivers the 15-minute values as CSV by email, daily, weekly, or monthly, depending on the engagement. You open the file in your analysis tool and get started.
The values come directly from the grid operator, in the same interval that billing is based on, with quality flags. If a grid operator corrects a value after the fact, the correction is carried into your data. For a load-curve analysis you need history: on the Light plan you retrieve up to twelve months retroactively, on the Plus plan up to 24.
What you use the data for stays your business: load-curve and standby analysis, preparing the EEffG short report, a data basis for ESG reporting. You will find an overview on the page for energy consulting. If you prefer to do the analysis in the platform, load-curve and peak-load analyses are available from the Plus plan upwards.
What this means for a growing consulting business
You start small: with the Light plan you bring in the data from your first client meters. As more engagements come in, the plan grows with you. The Plus plan is built for a larger client base.
And when an engagement ends? Your client's consent is revocable at any time; it belongs to them. When an engagement runs out, you end the data request for their metering point; the values collected up to that point you export for your records.
Frequently asked questions
How do I request my client's load curve?
Through a one-time release. You enter the metering point number, energiedaten.at requests the data from the grid operator, and your client confirms the release in their grid operator's portal. From then on the load curve arrives daily as 15-minute values.
Do I need the client's consent?
Yes. The consumption data belongs to the client, and they grant the release themselves in their grid operator's portal. Only with that consent does the data flow, and they can revoke it at any time.
Do I receive the quarter-hourly values?
Yes. Since the ElWG, quarter-hourly values are the standard resolution; an authorised third party receives them as soon as the client consents.
What tool do I need for the load-curve analysis?
The one you already use. energiedaten.at delivers the values as CSV, which you open in Excel, your BI tool, or your analysis software. Load-curve and peak-load analyses inside the platform are available from the Plus plan upwards.
Conclusion
The analysis you have covered. What engagements hinge on is getting the data beforehand. As long as that runs through your client's inbox, every new assignment costs the same week of lead time. With a one-time release per client, that work moves to the start: granted once, and then the data comes.
Get your first client's data: try it free with the Light plan.
For a growing consulting business: the Plus plan for a larger client base.
[1] E-Control, Smart Meter Monitoring Report 2025 (October 2025): rollout rate of 96.9% of the metering points to be converted, as of 31 December 2024.
[2] Elektrizitätswirtschaftsgesetz (ElWG), BGBl. I Nr. 91/2025, in force since December 2025: quarter-hourly values are the standard resolution; an authorised third party receives them after the customer's consent, with no separate granularity opt-in.
Stay up to date
Get new articles and product updates directly in your inbox.
Related articles
Request a load profile and analyse it without Excel
Request and analyse the load profile for one or many metering points: find the base load, the peaks and the patterns instead of sorting spreadsheets.
Smart meter data via API in Austria
Is there a Smart Meter API from Wiener Netze or EVN? How to read consumption data in Austria through one REST API covering every grid operator.
Would spot pricing have saved you? Your data knows
Does a dynamic electricity tariff actually save money? How the supplier markup, base fee, and your consumption profile decide your savings, and how to calculate it.
Reducing electricity costs: why businesses should make their consumption visible first
Switching tariffs and applying for subsidies help, but without visibility into your own electricity consumption, the foundation is missing. Smart meter data shows where the money actually goes.
Energy data made easy
Smart meter consumption data via API, webhook, or CSV for all Austrian grid operators.
Try for free