Reducing electricity costs: why businesses should make their consumption visible first
Grid fees and procurement costs are rising. Switching tariffs and pursuing subsidy programs help. But they don't answer one question: where exactly does your electricity actually go? Most businesses receive one number per meter per year. If you want to cut costs, you first need to see what you're consuming.
One number a year, and still cut electricity costs?
A familiar scene: the annual bill arrives, the amount is higher than last year, and management asks for action. The energy manager can switch suppliers, look into subsidies, renegotiate the tariff. All reasonable steps.
Most businesses know their annual electricity spend but not when or why it's consumed. Without that foundation, the most important question remains unanswered: when, where, and why is electricity being consumed?
The missing piece: granular, continuous consumption data from your own meters. Not one annual total, but a consumption profile that shows what's actually happening.
What 15-minute data reveals about your electricity costs
Smart meters record electricity consumption in 15-minute intervals: 96 data points per day per meter. Around 97% of electricity connections in Austria already have a smart meter.[1] And since the ElWG in December 2025, quarter-hourly values are the default.[2] Previously, consumers had to actively enable the 15-minute resolution; now it's the default setting.
With this data, three concrete cost drivers become visible:
Base load: what's running when no one is working?
Every business has an electricity consumption that never drops to zero: at night, on weekends, during holiday shutdowns. In quarter-hourly values, it appears as a flat floor in the consumption profile: the base load.
Server rooms, ventilation systems, emergency lighting, standby consumers, broken timer switches. In commercial buildings, base load often accounts for 30 to 50 percent of total consumption.[3] A significant share that remains invisible in the annual bill.
A concrete test: compare the Christmas week to a normal operating week. The difference is energy consumed without serving any productive purpose.
Five analytical patterns in quarter-hourly values shows in detail how energy managers can systematically analyze base load.
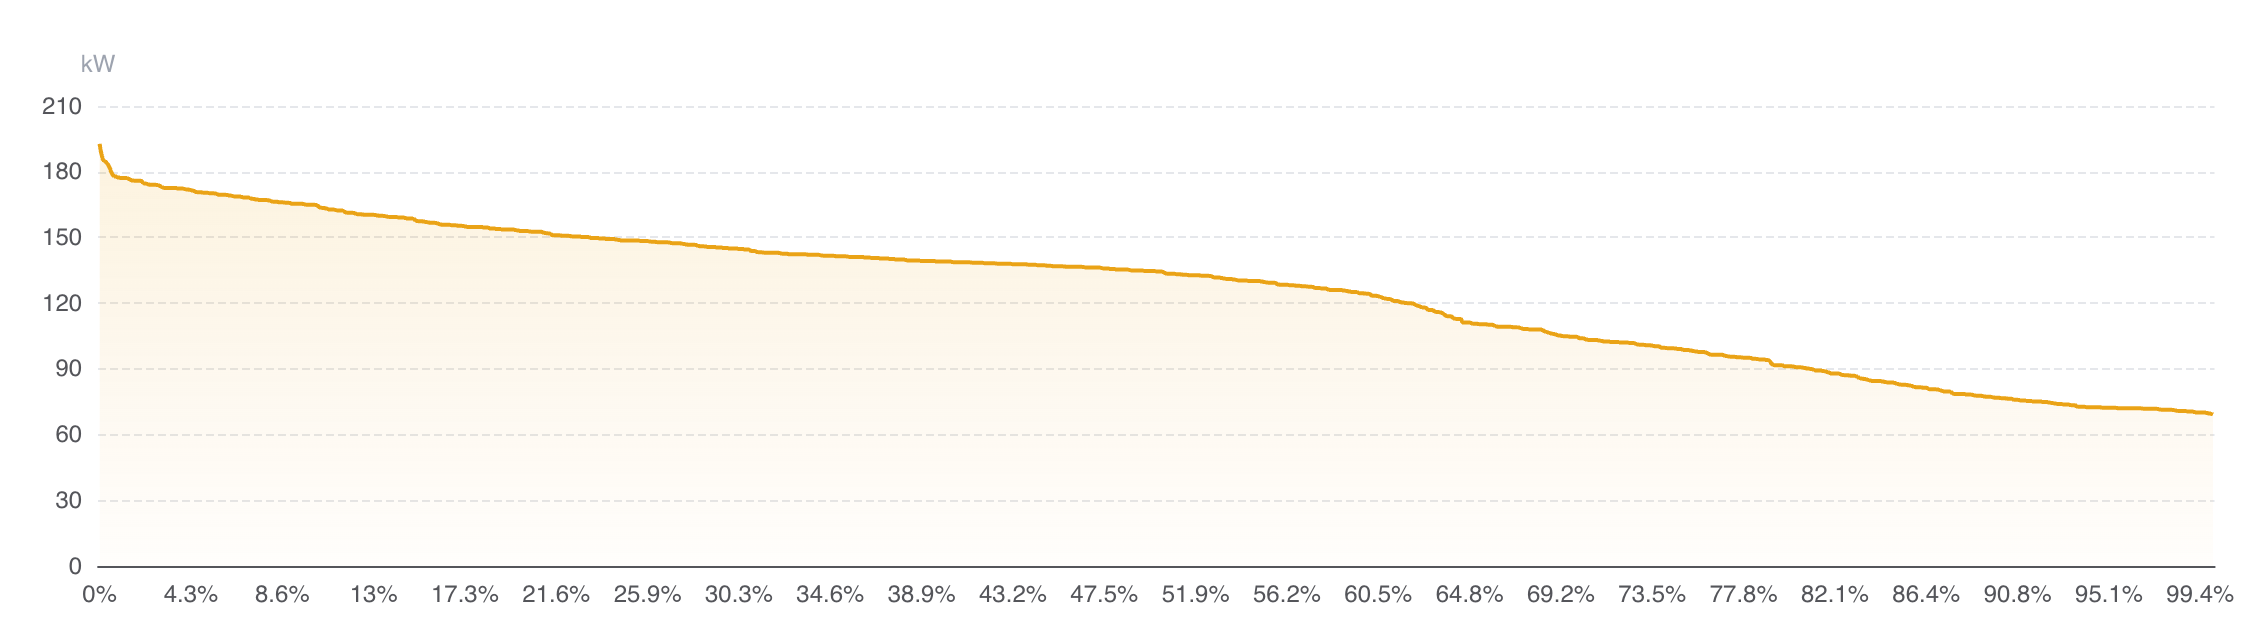
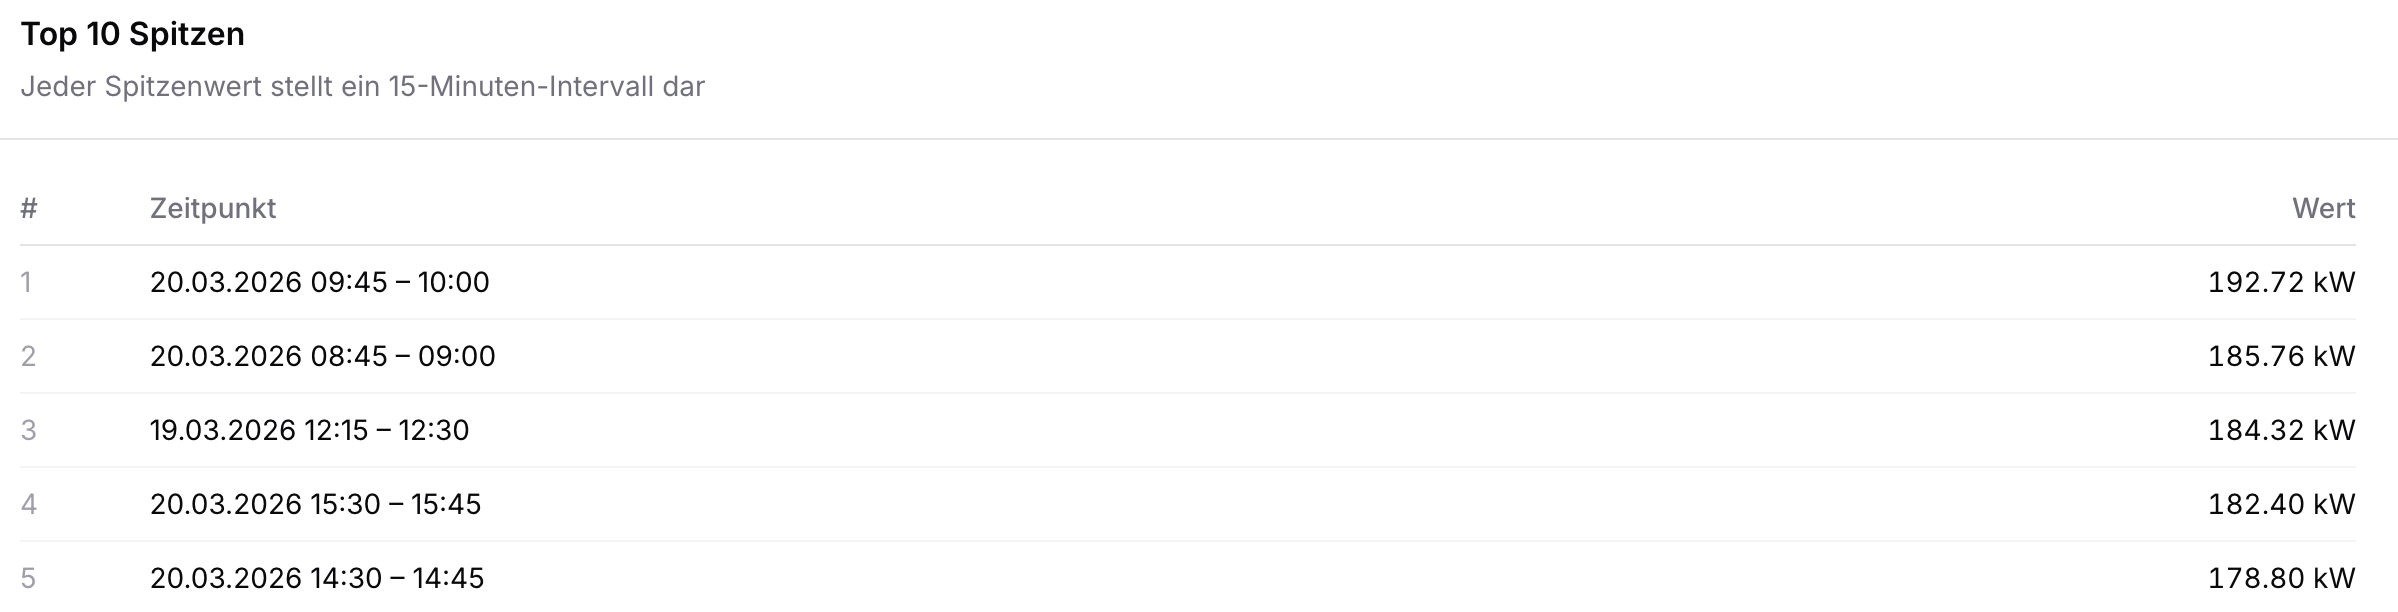
Peak loads: where does it get expensive?
Some businesses pay not just for kilowatt-hours consumed, but also a demand charge: the highest measured power demand in the billing period determines the cost for the entire month. A single 15-minute interval can make the difference.
Typical causes of peaks: simultaneous machine start-up on Monday morning, parallel air conditioning and production during hot days, EV charging during peak office hours. In quarter-hourly values, these peaks become visible, with exact timing and magnitude.
Not all commercial electricity tariffs include a demand charge. But regardless of the tariff model, knowing your peak loads helps with capacity planning and sizing the grid connection.
Devices that don't switch off
Broken timer switches, pumps running continuously, lighting that burns around the clock. In the annual bill, this goes unnoticed. In daily data, the anomaly becomes visible the next day: a sudden rise in the nighttime baseline, weekend consumption that's almost at weekday levels.
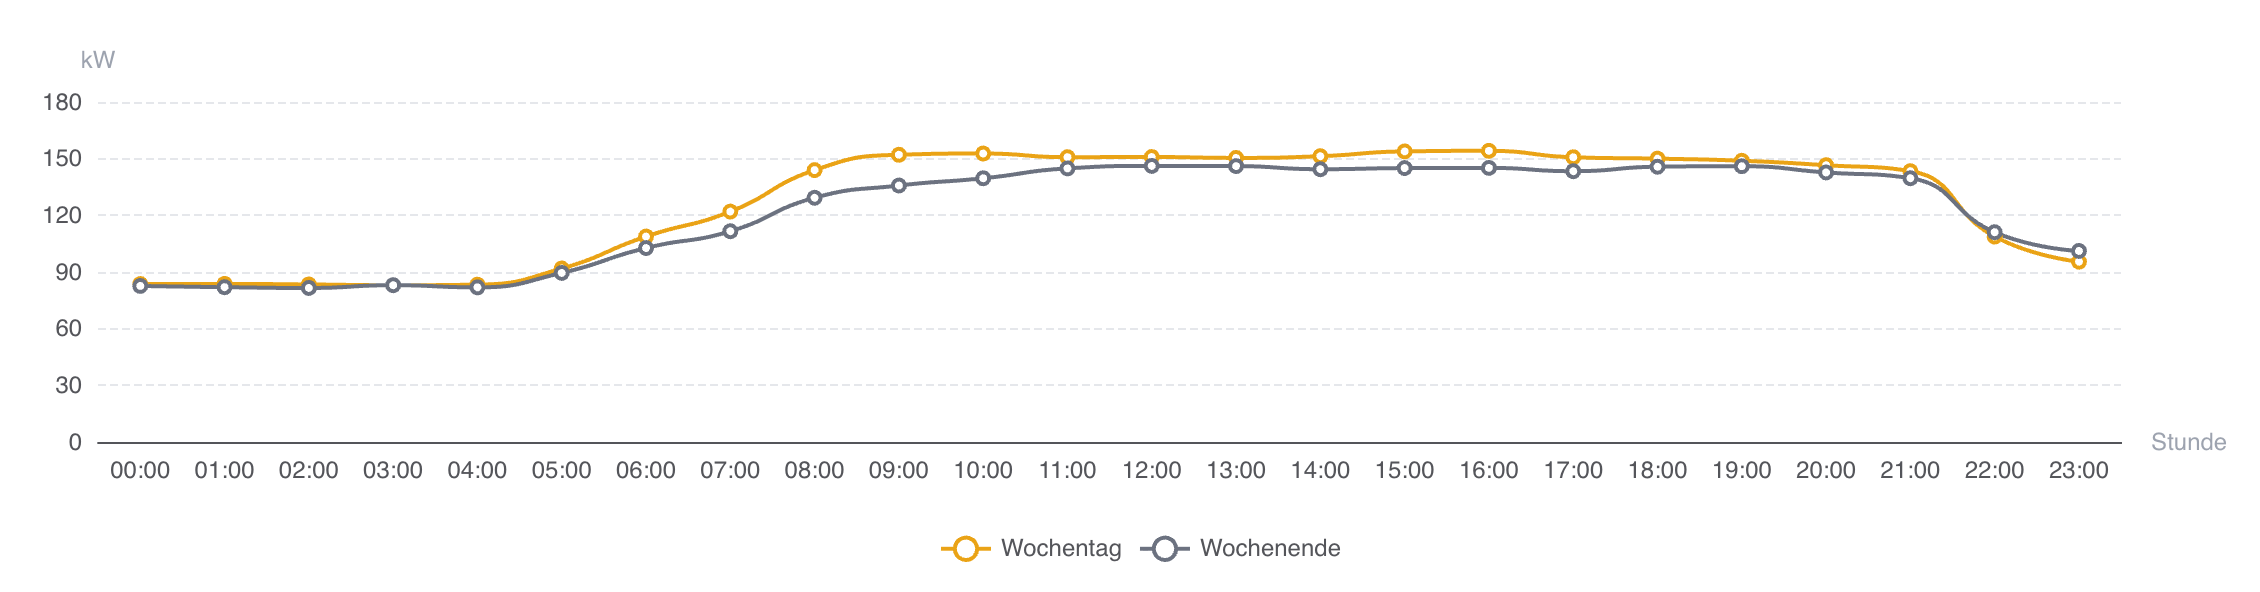 Daily profile of a commercial site: weekday (orange) and weekend (grey); weekend consumption barely drops below weekday levels. (energiedaten.at)
The cheapest kilowatt-hour is the one that isn't consumed.
Three measures that only need data, no budget
Once consumption data is available, three quick wins can be implemented that require no investment:
1. Fix control settings
Timer switches, motion sensors, air conditioning schedules: settings drift from their intended values over the years. A ventilation system that switches off at 10 pm instead of 6 pm costs four hours of electricity per night. In the consumption profile, this shows up as an elevated nighttime baseline. The fix: a trip to the control panel.
2. Load shifting
Spread out equipment start-up across the morning instead of everything at once at 6 am. Charge EVs overnight. Move energy-intensive processes to off-peak hours. Load shifting doesn't reduce kilowatt-hours, but it reduces peak demand and therefore peak-dependent costs.
For tariffs without a demand charge, load shifting has no direct cost impact. It's still worthwhile, though: for grid connection sizing and avoiding overloads. Since April 2026, the SNAP (Sommer-Nieder-Arbeitspreis) adds a grid-fee incentive on top.
3. Identify standby consumers
Devices that stay on when they're not needed, particularly at night, on weekends, and during holidays. The Christmas week is a good reference point: whatever is still running then is likely running unnecessarily all year round.
If you want to go further: professional energy management
Consumption visibility is step one. It shows where the money goes and enables quick improvements. For systematic, long-term optimization, professional energy management goes further: ISO 50001, continuous monitoring, structured efficiency programs.
BTM Energy, a Vienna-based energy management specialist, supports businesses from data analysis through ISO 50001 certification to ongoing optimization, since 2007.
Consumption data at 15-minute resolution is the working foundation for this kind of engagement.
For those interested in the regulatory side: What EEffG and CSRD require in terms of energy data explains the data requirements from a compliance perspective.
How do businesses access their smart meter data?
The infrastructure is in place: around 97% of electricity connections have a smart meter. The question is how the data gets from the meter into your system.
Grid operator web portals: Manual download as XLSX, limited to around 50 meters per portal. With multiple grid operators and dozens of sites, this quickly becomes laborious. Why automation pays off is covered in a separate article.
Building your own EDA connection: Specialized communication software, server infrastructure, 3 to 6 months of development time. The full journey of data from meter to system shows what's involved.
Managed data service: energiedaten.at handles communication with all Austrian grid operators. The process: enter the metering point number, the meter holder approves access on their grid operator's portal (typically seconds to hours, depending on the grid operator), after which data flows daily. Normalized from a network of over 140 grid operators into a unified format. Delivered via CSV email, API, or webhook.
Where to start
The first step is the same whether you start with your own quick wins or bring in a professional energy management partner: consumption data from your meters, at a resolution that makes base load, peak demand, and equipment anomalies recognizable.
Try it at one site: Light plan, 14 days free, 10 meters included.
For larger portfolios: Plus plan from €64/month, 20 meters included.
[1] E-Control, Smart Meter Monitoringbericht 2025: 96.9% of electricity connections in Austria equipped with a smart meter.
[2] ElWG, BGBl I 91/2025: Quarter-hourly values as default setting (opt-out instead of opt-in).
[3] dena, Leitfaden "Energieeffizienz in KMU" (2019); BAFA, Merkblatt "Grundlast reduzieren".
Stay up to date
Get new articles and product updates directly in your inbox.
Related articles
How Energy Consultants Get Hold of Their Clients' Consumption Data
Before the analysis comes getting the data, and that is exactly where consultants depend on their clients. How the client consents once and the consumption data then arrives daily.
Would Spot Pricing Have Saved You? Your Data Knows
Does a dynamic electricity tariff actually save money? How the supplier markup, base fee, and your consumption profile decide your savings, and how to calculate it.
Common area electricity under control: how property managers use smart meter data
Property managers receive common area electricity as an annual lump sum: one number, no detail. Smart meter data makes anomalies, trends, and savings visible.
Consumption analysis: 5 patterns in quarter-hourly data
Five patterns in quarter-hourly smart meter data that matter for EEffG compliance, ISO 50001, and efficiency analysis at the enterprise level.
Energy data made easy
Smart meter consumption data via API, webhook, or CSV, for all Austrian grid operators.
Try for free